Store and flux – it’s a game

Ecosystem stores and fluxes. Local-scale exchanges of energy and matter. Human as well as Biophysical stores. The threat of the big global flux. The basis of a computer game.

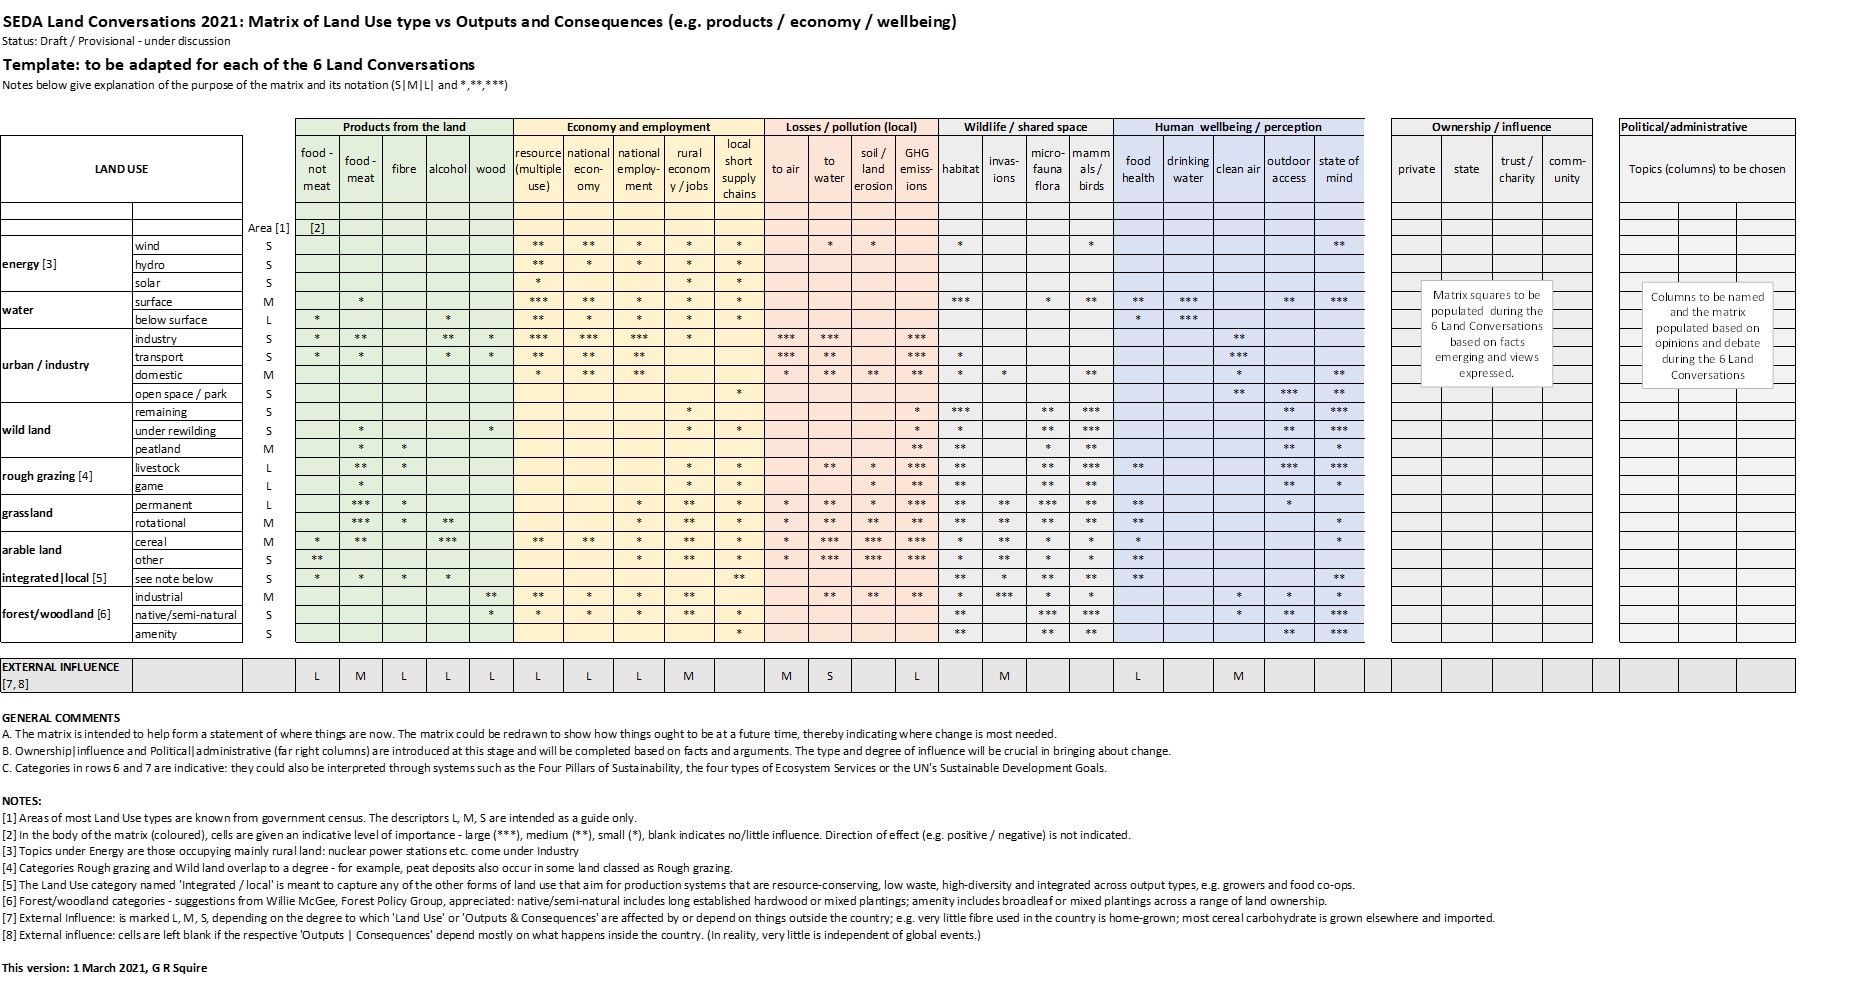
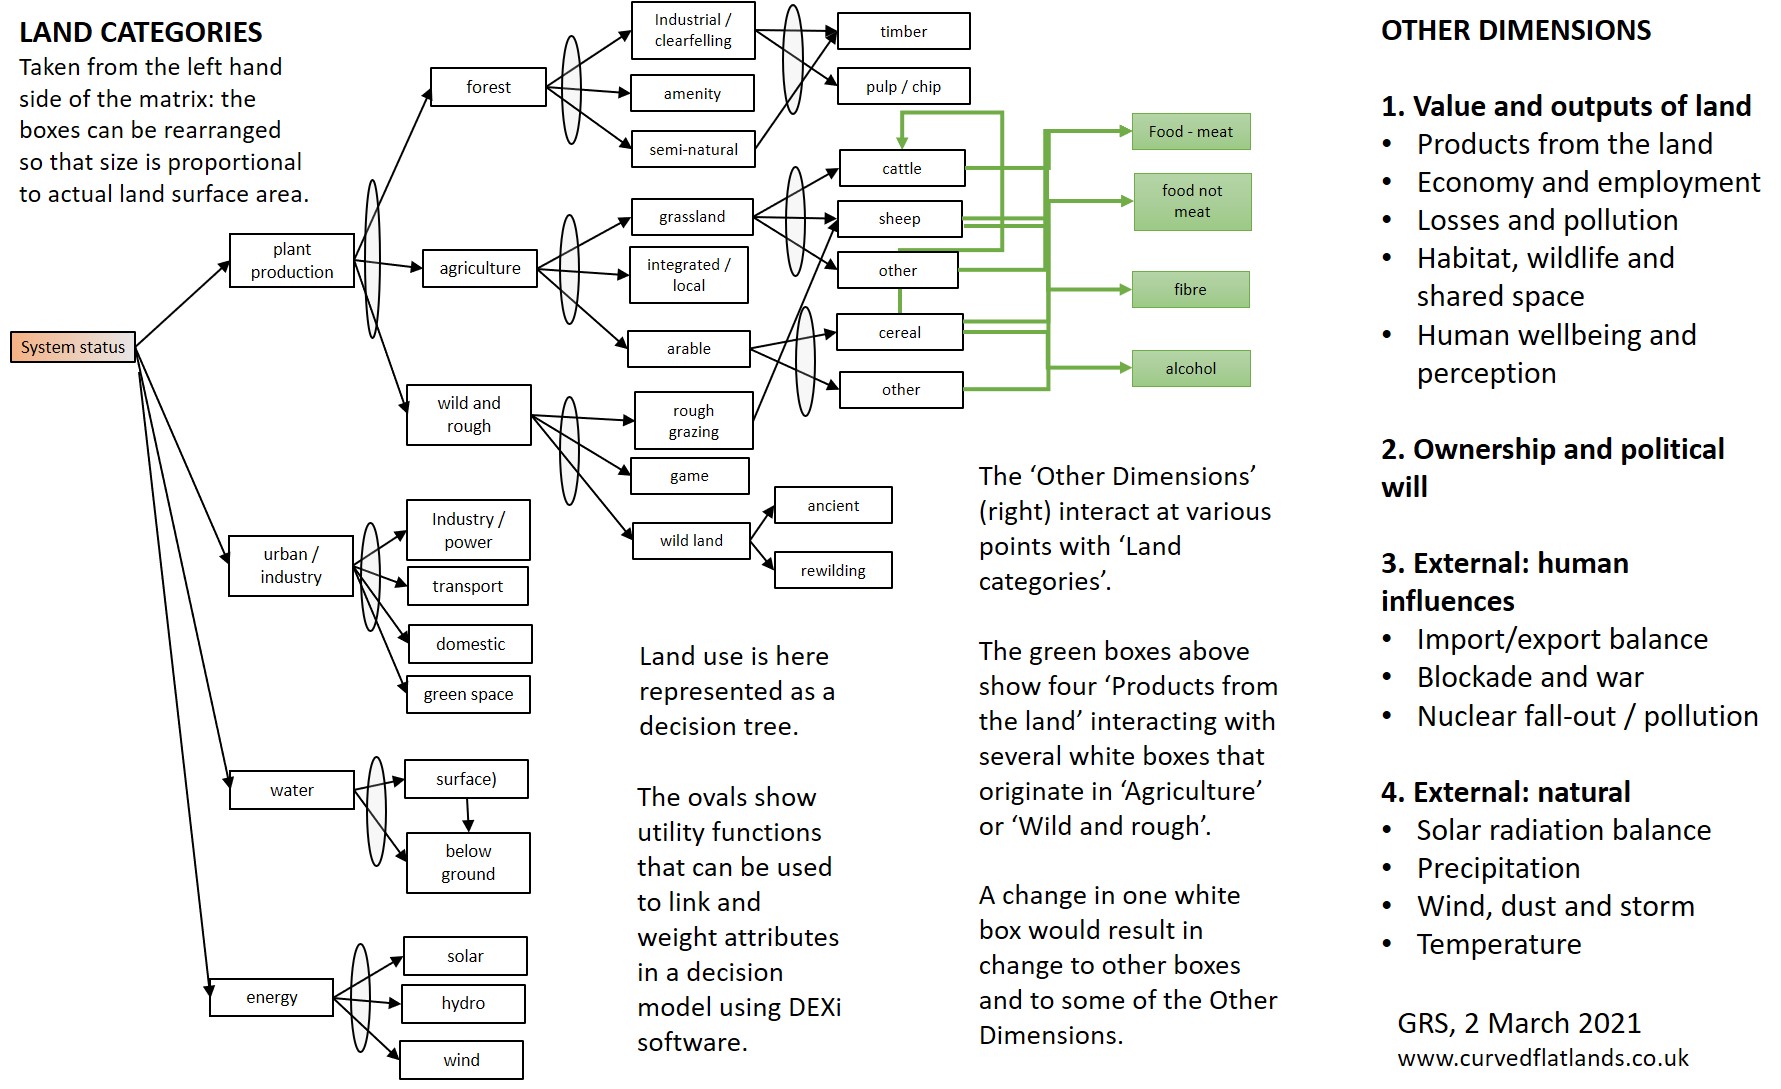
SEDA Land [1] – a part of the Scottish Ecological Design Association (SEDA) – has been working with students at the University of Abertay Dundee [2] on a computer game in which- after catastrophic events – communities are striving for survival.


Figure 1. The Ring of Brodgar, Orkney, built by early settlers who tilled the soil and grazed pasture, opening the way to today’s agriculture. Soils and essential biodiversity are degrading here, but it’s not the dust bowl yet. Images by Squire, inset shows a record (LP) cover – Dust Bowl Ballads by Woody Guthrie (more below).


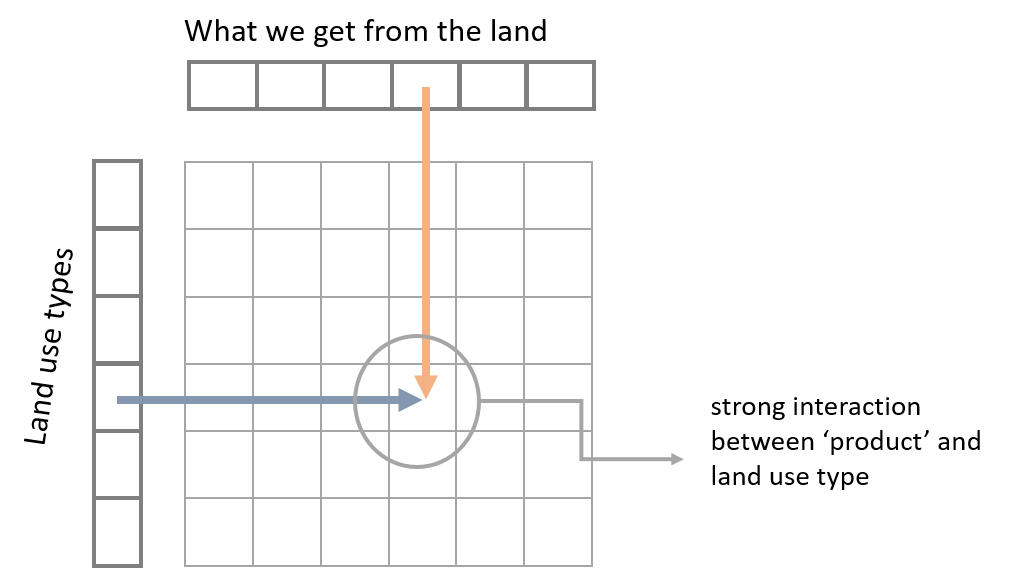
In the game, the communities have to provide a minimum of three things from the land – food, shelter and power. They have to grow crops, grass and livestock, make houses and barns from rock and trees, and generate power from turbines and other sources.

Land is in short supply. The communities have to work together or they fail. But there’s something else – a recent cataclysm opened portals to the other side. Standing stones, some with obscure icons carved into them, appeared in the landscape. The ‘veil’ thinned and fantastical creatures passed through, some to help the communities, some to cause mayhem. How will they cope!


Well the first thing (GS said) is to understand ecosystem stores and fluxes [3], first the real, then maybe the metaphysical. Here we look at stores and fluxes at two scales. But first a quick look at another portal, described in a work of poetry by Dante and portrayed by the artist William Blake [4].


From William Blake‘s illustrations of Dante‘s Divine Comedy, Inferno III [4] as Dante and Virgil are about to step through Hell-Gate (from one world to another), where they come across the tortured souls of the INDIFFERENT (those who did nothing?).

Figure 2. At Hell-Gate, between one world of soft leafy trees and another where souls move forever along rising paths through red and blue shards (fire and ice – climatic cycles?). Image taken by GS at the Blake Exhibition, Tate Modern, London, January 2020 [4].


Store and flux at local scales

All ecosystems are subject to large environmental ‘fluxes’ that are essential for life, but that can destroy life if not regulated. Most land-based ecosystems build a ‘store’, which consists of soil, plants, microbes, invertebrates, higher animals, and the ‘dead’ organic matter produced when these organisms shed tissue or die. The organic matter is ‘worked’ by the living things into forms that bind soil particles and hold water and the nutrients essential for life.

The main inward fluxes (Fig. 3) are of solar radiation, water, and in some cases deposition of dust, ash and chemicals carried by moving air. The store processes these fluxes to enable (for example) photosynthesis by plants in which carbon dioxide from the air is converted to plant matter, and fixation of nitrogen from the air by a symbiosis of soil microbes and roots.

Figure 3. Diagram representing ecological stores (in the box) including soil (mineral particles, dead organic matter, etc.) and living matter (plants, microorganisms, invertebrates, etc.), and fluxes of energy and matter into (black lines) and out of (orange lines) the store. Based on Squire & Hawes, 2024 [3].

The main outward fluxes (Fig. 3) are long-wave radiation from the plants and soil that have been warmed by solar energy, evaporation of water (termed transpiration when this moves through plants), gaseous emissions to the air from breakdown of organic matter, further loss of water and materials as surface runoff and drainage to bedrock, and the loss of store particles by the same forms of air movement that also deposit material.

For a system to have resilience, its stores and fluxes have to be balanced. The store must regulate the fluxes to survive. It mostly does so in a natural system. But when people came to use the land, to cut trees, grow crops, and graze animals, they added two extra fluxes: inputs such as cultivation, controlled burn, new seed, livestock, fertiliser and more recently big machines; and offtake of material for food, clothing and timber.

Over time, the inputs and offtake have become so large that they commonly lead to imbalance in the system, generally to its detriment. While managed ecosystems can in principle last for many thousands of years, they can also be destroyed in a few decades by mis-management. Imbalance in store and flux and subsequent destruction of the store for short-term gain, whether intended or through ignorance, is named extractivism. The US Dust Bowl is a classic example (Fig. 4).

From the Dust Pneumonee song by Woody Guthrie

I went to the doctor and the doctor said my son (repeat), You got that Dust Pneumonee and you aint got long, not long.

My good gal sings the Dust Pneumonee Blues (repeat), She loves me cos she’s got the Dust Pneumonee too.

Figure 4. Cover of the classic Woody Guthrie record of songs about the US Dust Bowl released by Folkways some decades ago. The people most affected by such environmental catastrophe are usually the poorest, the vagrant, not those who encourage the change or set the policy. The words above left are from one of the songs; those below from inside the record sleeve [5].

The pioneering ax and plough rapidly upset the interplay of natural forces that had formed and preserved rich soils ….. The same tide that rolled the frontier forward from the Atlantic rolled back nature’s stabilising mantle of trees and grasses and bared virgin soil to weathering.

John Asch

But something is missing from Fig. 3 – the knowledge and experience that people have in managing land is also part of the store …. and no matter how good the management, the store can be affected by distant forces.

The store of knowledge, continuity and community

The diagram in Fig. 3 therefore represents only one part of a managed ecosystem. The other part of the store is held by the People that live and work on the land (Fig. 5). The People not only give to and take from the biophysical store but they form an additional store in terms of their knowledge, experience and social connections.

Figure 5. Diagram to represent an ecosystem in terms of its biophysical components and its communities of people (orange boxes), both under constant threat from large global fluxes, here divided into Biophysical and Human (blue boxes).


Probably more so that at any other time, ecosystem stores are now under threat from extractivism. Inputs and offtake have become so great that they dominate the store. This need not be, and we can learn from those examples of successful stewardship.

Yet well managed systems are under threat from things well outside their control. In talking to the Abertay students, these threats came to be called ‘Big Fluxes’ (Fig. 5).

Threat of the Big Flux

The Big Fluxes can be divided broadly into those having Biophysical and those having Human causes. The Biophysical, such as volcanic eruption, tsunami, flooding, and cycles of global cooling and warming, are outside the control or influence of any parcel of land and its people. Many of the Human causes are also outside local control – take war, blockade, nuclear fallout and the acts of occupying ideologies to force mass starvation and genocide. In some cases, the controlling hands are physically closer to the scene – take the evictions and clearances that depopulated rural Scotland in the 1700s and 1800s.

But some Biophysical forces can in principle be influenced by Human intervention, both inside and outside the land in question. For example, disease epidemics (and pandemics) may have originated well outside the land, but their spread to and within the land could have been limited, more than they have been recently, through better understanding of the infection process and more effective control.

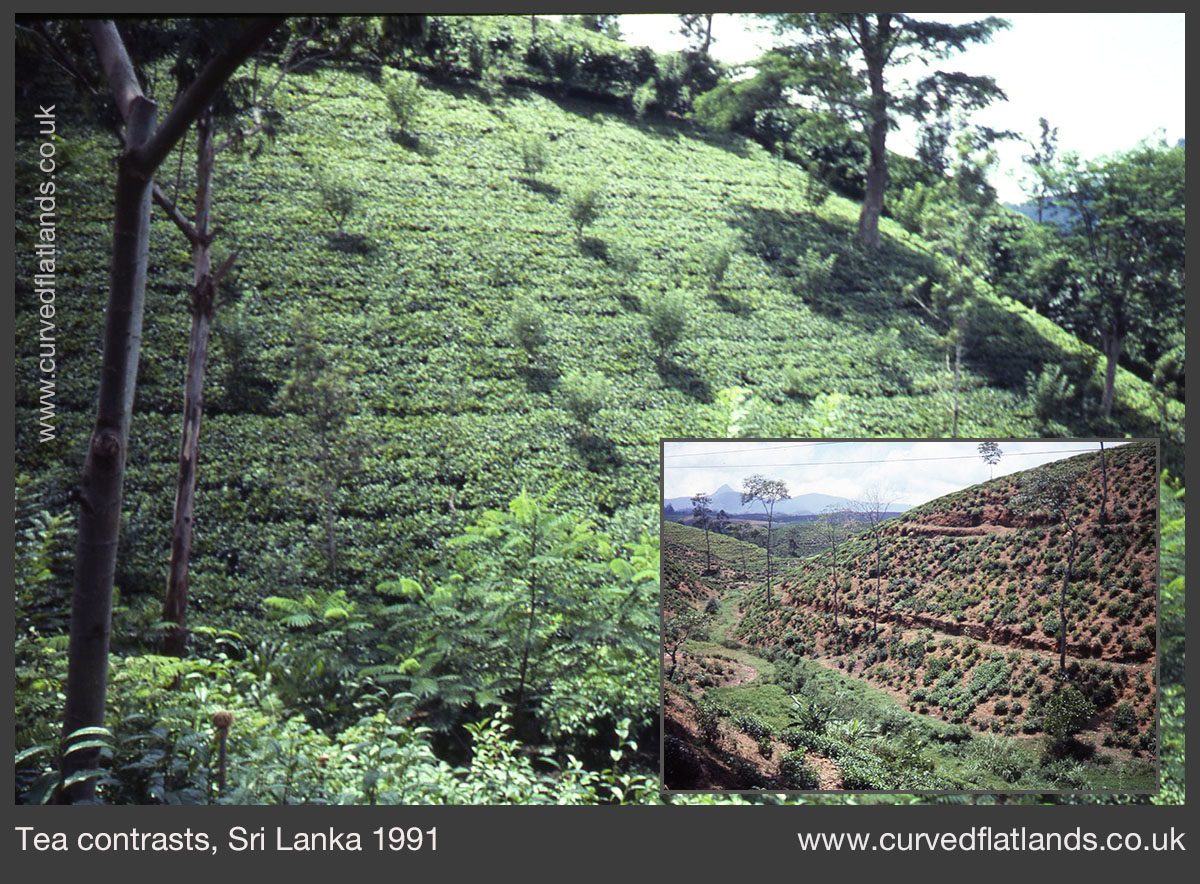
Can anything be done to make the local stores and fluxes in Fig. 3 resilient to a Big Flux? To a degree it can, for some of the Big Fluxes. For example, if agricultural or grazing land is denuded of perennial vegetation, its soil over-cultivated or over-grazed, the organic matter allowed to degrade and the surface left exposed, it will suffer more under flood and storm than if it was properly cared for (Fig. 6). And fire-prone forest and bush can to a degree be protected by creating breaks and reducing the store’s burnable material.


Figure 6. Erosion gulleys like this form in many parts of the world, mainly when gradual soil degradation over a long period (which may be unnoticed) is scaled up to catastrophic erosion during extreme rainfall and flood. Most organic matter, including roots, in the photograph above occupies the upper 10 to 20 cm of soil (short vertical bar). Some roots, mainly of the shrubs, can penetrate the red soil layer to 0.5-1.5 m (long vertical bar). Arrows show the ends of roots exposed after the collapse of the soil into an erosion gulley 5 m deep. Photograph by Squire, south-east Asia, 2014.


Forgetting the Big Fluxes

The situation that needs to be faced, in reality and in the game, is that People forget about the Big Fluxes. There will be another, there’s no doubt, but People fail to prepare for it.

Some Big Fluxes are so infrequent that generations, sometimes centuries, even millennia, pass without experience of them. The last major tsunami to hit Scotland was thousands of years ago and the last volcano to throw its ash this way was Laki, in Iceland in 1783-84.

Others Fluxes are more frequent but governance repeatedly fails to act. In Scotland, and in the UK as a whole, home-grown food production fell well short of feeding the people in the run of bad-weather years in the late 1870s. Rather than giving long-term technological support for agriculture, the government filled the void by importing food from north America, leaving agriculture to suffer and its people to leave the land.

A few decades later, and in the face of blockades in 1914 and 1939, the country again had to rely on imports. Even now when its advanced agricultural technology could in principle feed the people, it would still fall well short in a face of blockade. Extreme climatic events elsewhere could have the same effect. Imagine that drought destroyed the vegetable harvest in Spain and north Africa. Where would the UK get its veggies from?

So ‘memory’ of the big fluxes needs to kept by people, by their communities and in their shared history.

It’s a game

How is all this going to be realised in a computer game? Well not all of it, at this point, but things like soil, vegetation, livestock, rock and power sources can be represented spatially. People have a choice as to whether they build their stores and extract materials sensibly, or let them degrade and ultimately fail.

They might be succeeding, and all looks good, but then what’s the chance of a Big Flux! Can other forces help them? It’s a work in progress.

Further information on soils, agroecological farm practice, early game plans, Pictish art, livestock and related topics discussed with the Abertay students can be found on subsequent pages of this post listed after Sources | Links.

Author | contact: For this article: geoff.squire@hutton.ac.uk or geoff.squire@outlook.com. For SEDA Land and development of the game: gail@halvorsenarchitects.co.uk. Lorna Dawson at SEFARI Scot gave ideas and information on a range of topics: lorna.dawson@hutton.ac.uk.

Sources | Links!

[1] SEDA Land: https://www.seda.uk.net/seda-land

[2] Abertay University: School of Design and Informatics

[3] Store and flux and related agri-ecosystem processes are described in a book chapter to be published ‘open access’ in August: Squire GR, Hawes C (2024). Biodiversity for Agriculture – the role of integrated farm management in supporting agriculture through biodiversity. In Managing Biodiversity in Agricultural Landscapes. Burleigh Dodds Science Publishing.

[4] William Blake (1757-1827) made many illustrations based on events in the Divine Comedy by Dante (1265-1321). Some were shown at an exhibition William Blake at Tate Modern in 2019-2020 and the complete set is now available in a book – Schutze S, Terzoli MA – William Blake – Dante’s Divine Comedy – The Complete Drawings, published by Taschen. The Divine Comedy is available in paperback and in online translations at Project Gutenberg and Digital Dante.

[5] Dust Bowl Ballads by Woody Guthrie, Folkways Records, 1964: see Smithsonian Folkways. More on the Dust Bowl at livingfield web: Dust Bowl Ballads which includes links to the pioneering work on soils by Hugh Hammond Bennett, e.g. Bennett HH, Chapline WR. 1928. Soil erosion a national menace. Circular No. 33, United States Department of Agriculture. 

[6] William Blake and the Dust Bowl were both referred to in an earlier presentation and web resource viewable on the curvedflatlands web at Soil: healing the skin. The healing remedies include Bandage (e.g. coverings) and Ointment (e.g. exudates and other organic matter from grass-crop-tree mixtures). Click for a PDF file of the presentation.

Continued …..

Further background to a range of topics discusssed with Abertay students over the last few month – click on the page number links at the bottom.

Page 2 More on soil degradation under agriculture and forestry and ways to avoid it by Lorna Dawson and Geoff Squire.

Page 3 Early project ideas and descriptions offered to the Abertay students by SEDA Land and James Hutton Institute (Geoff Squire, Lorna Dawson, Gail Halvorsen and Pete Iannetta).

Page 4 Pictish art – some standard books and links to active groups and people.

Page 5 Sheep, cattle, walls and fences – including examples of ancient breeds.

Community mapping – food, climate

SEDA Land’s mapping initiatives. Communities, landowners, science, technology, computer gaming. Food sourcing and food security. Local vs global. Spatial data and the need for local knowledge. Building resilience to global disruption.

SEDA Land arose from the Scottish Ecological Design Association’s 2021 Land Conversations as an active and inclusive grouping intent on exploring and then influencing the way we value and manage land and water [1].

One of the first developments from the Land Conversations was an idea to ‘map’ the land around a place or community for its capacity to provide for the people, now and in the future. That capacity included food, water, wood, open space and a sense of place. The ideas quickly developed and by early 2022 took form through collaborations between many people and organisations in a project called Mapping Future Food and Climate Change.

A map of fields (inset) on a farmed landscape, Aberdeenshire (original photograph by GS).

Community – land – science – art – gaming

A pilot study began in 2022, based on the locality of Huntly, comprising a range of community groups, schools and local landowners [2]. Scientific institutions are providing knowledge of soil, crops, food, carbon storage, greenhouse gas emissions [3] and expertise in computer gaming [4]. The main elements of the pilot study are as follows.

  • The land in and surrounding the town, and its nature, shape, occupancy, community involvement and ownership.
  • The biophysical status of the land, its climate and weather, bedrock and soil, carbon storage, biodiversity.
  • Structure of the land – mapping ‘parcels’ or units of management (e.g. fields, woods) and what they produce or contribute.
  • The community’s use of locally-grown products versus the import of things grown on resources elsewhere.
  • The meaning of the land to the people, expressed through tradition, art craft, music [1].
  • Definition and analysis of spatial and temporal ‘layers’ (e.g. area, soil, climate, use, inputs, outputs) to understand the current value and limitations of the land and its future potential for delivering benefits such as food security, C sequestration, biodiversity and community involvement.
  • Expressing all of the above through computer gaming.

But where do we begin … ?

Fig. 1 Map of the Climatic Conditions in Scotland, published 1970-72 by Birse and colleagues at the Macaulay Institute for Soil Research [5].

Mapping the biophysical, economic and political landscape of Scotland has a history going back several hundred years. The climatic maps produced in the early 1970s from the Macaulay Institute for Soil Research (Fig 2) are among the most spectacular. The arable-grass agricultural land lies mostly in the red and yellow areas around the east coast and across the central belt.

In the half-century since Fig. 1, digital maps have become the norm, now available online for many features – including land classification, soil and soil carbon content, erosion and compaction risk, and land suitability for agriculture and forestry [6]. The study based around Huntly will be able to use the maps, and the data behind the maps.

Fig. 2 An area of land, a few kilometers in diameter, in which the individual parcels are identified, each having the potential for distinct and different land use [7].

Mapping land and land use

The patterning of the land is one of the first things to appreciate, and in particular the division of the land into the units of management. Why is this important? Well … suppose three fields have similar soil, slope (etc.) but one is woodland, another is grassland and the third is cropland. They all differ in what they produce, their agrochemical and mechanical inputs, the carbon they store, the biodiversity they support and what they conserve or release to the wider environment. Therefore the management of the field is just as important as its underlying qualities.

Mapping fields and other land parcels in fine detail is now possible (Fig. 2). Their shapes can be made visible and to a large degree, but not completely, the use of the land in each parcel can also be defined. Without even visiting the area, the parcels containing established vegetation such as woodland and marsh can be identified from remote sensing and each of the agricultural parcels can be separated into grassland and arable (or cropped land) using data from government census.

The sequence of crops grown in an arable field can also be defined, and from that, combined with data on soil, climate, outputs (yield, etc.) and inputs (agrochemicals, etc.), the capacity for carbon storage end emissions can be estimated or modelled.

Let’s get on with the mapping.

Fig. 3 The parcels of land in Fig. 2 supporting grass for livestock grazing (left), crops such as barley (centre) and a variety of other uses in agriculture and forestry (right) [7].

Given the right information [7], the shapes can be coloured to show the different forms of land use. In the example in Fig. 3 – based on the field patterns in Fig. 2 – the first to go in is grassland (Fig. 3 left), then tilled or arable land (centre) and third, the remaining areas consisting of woodland, vegetables and fruit, minor crops that occupy relatively few fields, and also semi-natural vegetation (right).

When all land parcels have been identified, the map looks as in Fig. 4: a complex mosaic of land use types that gives the Atlantic zone maritime its unique features. Some of the patterning originated hundreds, even thousands of years ago. Like much of lowland Scotland, and despite removal of the original vegetation, the fields are diverse in size and shape, with little evidence of prairie agriculture that continues to degrade so much once-natural land in many parts the world.

Fig. 4 The three parts of Fig. 3 brought together, where each colour represents a distinct type of land use [7].
Limits to data – the need for local knowledge

Because of the way land use has been recorded historically, the arable fields can be defined by the crops grown in them, such as barley, oats, wheat, beans, peas, oilseed rape, potato, turnips, and so on. However, grassland – which often occupies the most land in regions of lowland Scotland – tends to be lumped in just a few categories. In the current census, the two categories are grass present in a field for under 5 years and grass in its fifth year and over. This lack of definition in grassland obscures the great variation found across Scotland’s managed grass in terms of biodiversity, soil carbon content, fertiliser inputs, greenhouse gas emissions and grazing potential.

Several other factors important for the study cannot be gained from current surveys. It is not possible to know from remote sensing or census data the quality and purpose of the product and whether it is consumed locally or exported from the area. For example, a field of cereal (barley, wheat or oats) could be used for malting (alcohol), livestock feed or milling to produce flour. The cereal feed might be given to livestock on the same farm or sold to a merchant to be used in another place. Even much of the grain used for milling – though small in quantity compared to malting and feed – will be sold to merchants for distribution elsewhere.

And it’s not possible to know what the landscape means to the people who live in the area. So for these unknown or uncertain features, we must add in local knowledge ….. that provided by the general community and the people that manage the land.

Next steps

SEDA Land, the Huntly Community interests and the academic partners are now looking to obtain grant funding. In the meantime, several of those involved will be scoping the digital mapping and other background data available online and members of the mapping group (1-4] will be getting to know each other through meetings, real and virtual.

By way of introduction to the project, SEDA Land is preparing a set of questions asking people’s perceptions of what the land around Huntly provides – for example, how much food and timber is grown locally rather than imported. The questions are intended primarily for schools but will be available to any in the community.

Fig. 5 Map of a region in Scotland showing land in broad categories: the lower altitudes support arable (crops) and grass, shown in green and yellow; the higher reaches, especially to the top of the image holding mainly rough grazing. Map prepared by the James Hutton Institute as a contribution to Nourish Scotland’s work on food systems [7].
Spatial scales and land categories

One of the first things the group will consider is the spatial scales at which data will be recorded and the categories into which land is divided. An example of broad land use categories is given in Fig. 5, which represents a tract about 30 miles at its widest. This sort of mapping gives a quick guide to the general possibilities for food and timber production. Green and yellow is already under managed agriculture. Orange, which covers more than half the area, is of low productivity, mostly used for extensive grazing of sheep, but offers possibilities, for example, of woodland regeneration.

Fig. 6 An area of land, lower altitudes to the bottom-right containing many small fields (average area around 7 ha), rising in height to large units of more open moorland at the top [7].

Much finer detail can be defined, as in Fig. 2-4, giving clues as to how local topography, soil, microclimate and past management determine the patterning of fields and what can be grown in them.

The fields and other units in a tract of land a few kilometers wide are shown in Fig. 6. The area to the bottom of the image, comprising many small fields, has been in agricultural use for thousands of years, but records exist of its conversion into high-quality arable and grass from the time of the monastic improvements beginning in the 1200s. The top of the image is higher land which would have been woodland in prehistory, but now comprises large units of open moor or rough grazing. The strands of small fields running down from the moorland identify water courses. Fig. 6 is taken from the upper left of the larger area shown in Fig. 7.

The scientific contributors will assist with defining scales and data, but anyone with interest in the project can begin now with online and free-to-use mapping through the National Library of Scotland and Ordnance Survey [8].

The curvedflatlands web site will be publishing further news, posts and comment over the coming months and maintains a growing inventory of relevant data sources [9]. The SEDA Land web pages [1] will be the formal point of contact for the project.

Fig. 7 Fields and other land units delineated over a landscape bordering the sea (in white), two crop types identified by orange and yellow colour; width 47 km. From work by Nora Quesada, Graham Begg and Geoff Squire at the James Hutton Institute [7].

Sources | Links

[1] SEDA Land is part of the Scottish Ecological Design Association: https://www.seda.uk.net/seda-land. A working group within SEDA Land, including all the participants, is taking forward the work on community mapping. Primary contact for the project: Gail Halvorsen, email: gail@halvorsenarchitects.co.uk. As in the Land Conversations, writing, poetry, art, craft and music will be integral. Contact: Sophie Cooke (sophie.cooke1@open.ac.uk).

[2] Primary contact: Huntly Development Trust www.huntlydevelopmenttrust.org. Email: Jill Andrews (jill.andrews@huntly.net). Local schools and landowners are active in the project.

[3] The scientific input is guided by the James Hutton Institute and Scotland’s Rural College (SRUC). Contacts at JHI: Lorna Dawson (lorna.dawson@hutton.ac.uk) and Cathy Hawes (cathy.hawes@hutton.ac.uk). Contact at SRUC: Mads Fischer-Moller (Mads.Fischer-Moller@sruc.ac.uk).

[4] The University of Abertay, Dundee, will be working towards gaming design through a post-graduate student group starting later in 2022. Contact: Kenneth Fee (k.fee@abertay.ac.uk).

[5] E L Birse and colleagues at the Macaulay Institute for Soil Research (now part of the James Hutton Institute) produced three classic maps on the Assessment of the Climatic Conditions in Scotland. The one shown is the last of the three, credits as follows:

[6] The James Hutton Institute’s online resources: Scotland’s Soil Data and other maps accessible from that page .

[7] Data for defining land use (crops, grass, etc .) in Fig. 3, 4, 5, 6 and 7 came from EU’s Integrated Administration and Control System (IACS) and was spatially analysed by Nora Quesada, Graham Begg and Geoff Squire at the James Hutton Institute. The maps in Fig. 4 and 7 were published some years ago on the Living Field web site at Scaperiae. Contact: graham.begg@hutton.ac.uk.

[8] Online map resources The National Library of Scotland has an increasing range of historical maps available online at the Map Images Homepage. The Ordnance Survey’s extensive downloadable resources are at Open Data Downloads and for education, see Free Education Resources for Teachers, and Digimap for Schools.

[9] curvedflatlands is compiling an inventory of mostly online data on land, soil, vegetation, biodiversity, climate, etc., which will be updated as new material becomes available: Sources of Information.

Author / Contact: GS has been working with SEDA to develop the 2021 Land Conversations, is on the steering group of SEDA Land and keeps (honorary) links with the James Hutton Institute. email: geoff.squire@outlook.com or geoff.squire@hutton.ac.uk

[Page online 10 March 2022, minor edits 27 March 2022]

Carbon Tax Land Conversation

John Muir Trust – SEDA Land: online conversation on a carbon tax for land

The newly formed SEDA Land [1] organised an online conversation on 10 November 2021 in which the John Muir Trust [2] set out its proposal for a carbon tax on land. Several invited responders then commented on the proposal. Members of the audience asked questions via a chat line.

It was a much needed debate. Land is being degraded and losing its store of carbon in many parts of Scotland. The diagram below was constructed as a step towards completing my understanding of the complexity of interactions linking a carbon tax to land management and hence land-based carbon storage and GHG emissions.

Complex sets of processes are identified as single boxes, some grouped and some linked by arrows. Boxes shaded grey are those that (the author suggests) received most discussion during the Conversation.

Click to see a larger image

Figure 1. Decision trees (simplified) linking interventions on the right (taxation, inducement, management) though land type to biophysical processes (centre) and ‘pillars’ of sustainability.

Change in management inevitably leads to some alteration in the biophysical and social-economic parts of the overall ecosystem and so will have a range of outcomes other than those on carbon and emissions. Some of these outcomes may be unintended or unexpected. 

A general feeling at the meeting was that there should be a broad, holistic approach to defining the problem and executing the solutions. Less silo-ing among all parties involved is therefore needed.

Explanation of the diagram

The structure is based on a decision tree of the type created in DEXi software [3]. Starting from the left , the system is divided into biophysical and social-economic attributes (A, B) but there is nothing rigid or fixed in this – other categories could be placed here. Both branches subdivide into other branches (technically called nodes and leaves) which can be extended as needed to include the fine-scale workings of the system. Regulation of carbon and emissions (box C) can only work through the biophysical attributes (e.g. primary production, organic matter breakdown, microbial activity, food webs, element cycling, etc.) which are not shown in detail.

Carbon and emissions are of course not the only high-level attributes linked by biophysical and social-economic processes. All the others – food, industrial products, alcohol, wood, fibre, power – are represented by box D.

Three groups of  ‘interventions’ are shown influencing boxes C and D (and hence A and B). First, to the far right, are those related to taxation (G): the boxes within G indicate some of the topics discussed at the meeting, for example, area-thresholds and criteria for defining carbon in land. Taxation, etc. has to operate through land management (box F) – and while the current proposal is slanted towards land of low agricultural productivity, there are strong arguments not to exclude managed grass and arable lands, which can hold much more carbon and emit far less than they presently do. Management interventions operate through land types or classes which are shown in a separate box (E). Change in one land category generally affects what goes on in another.

External influences

A particular part of the diagram (at the bottom) alludes to a crucially important set of processes – those that act from outside the region or country but have a great effect inside it. So over-reliance on imports, and purchase of land by external countries and corporations as a means to carbon offsetting, will put a break on internal interventions designed to increase the biophysical and social-economic sustainability of land.

It is essential therefore to include within the set of interventions (G) explicit regulations – here termed global responsibility – that are designed to prevent aggressive purchasing of land within the country and despoilation (including ecocide) in other countries. Interestingly the international crime of ecocide was defined by lawyers earlier in 2021 [4].

Despite the complexity of the topic, the scientific and technical capability to set criteria and estimate C storage and emissions is within reach. Moreover, the examples given at the meeting of how energy-use can be graded (for example for appliances and domestic housing) and of how taxation has already reduced damage to society, show that the approach proposed by JMT could work.

GR Squire, draft for SEDA 12 Nov 2021, modified and uploaded to curvedflatlands 27 November 2021 (with minor edits 8 December 2021).

More to follow

Sources | links

[1] SEDA Land’s web site describes the formation of the organisation and gives information on recent and upcoming events https://www.seda.uk.net/seda-land

[2] John Muir Trust https://www.johnmuirtrust.org/

[3] DEXi by Marko Bohanec: more on this web site on the functioning of decision trees and links to the software at SEDA Land Conversations.

[4] Ecocide – The Living Field web site under its DIARY21 lists developments during the present year by those intent on bringing the crime of Ecocide to public attention. DIARY21 gives links to reports and announcements.

SEDA Land Conversations – matrix and decision tree

The SEDA Land Conversations, online in March and April 2021, have taken place and the report on them is due in June. Updated matrix and decision tree, used to guide content and summarise developments, are described here.

The series of SEDA Land Conversations – A New Vision for Land Use in Scotland – was held online between 1 March and 12 April 2021. This post updates a previous description of the matrix and decision tree that were used to define the scope of the conversations.

SEDA’s approach for assistance with the Conversations at the end of 2020 was welcomed in a previous post – Land Conversations 2021 – which related some interactions with SEDA several years ago.

Introduction

Two simple devices were used to assist development of the Land Conversations: a 2-D matrix and a decision tree. Each of these depicted connections between two of the several ‘dimensions’ through which land use operates and can be influenced:

  • Basal states (topography, soil, climate)
  • Land Use types
  • Outputs and products from the land – ‘What we get from land’
  • Governance and society (often two separate dimensions) including ownership, public needs, power balance, political will
  • External influences – mainly human causes – including global food system, import dependence, and then blockade, war, global pollution.
  • External influences – mainly ‘natural’ – e.g. volcanic eruption, mass-transfer by air.

These dimensions are presented for illustration here – they are not all-encompassing, not fixed. The first three in the list tend to be directly connected, in that Outputs and products depend much on basal states but can also influence basal states (e.g. several thousand years of deforestation, two decades of growing potato).

Matrix

A spreadsheet was constructed (Fig. 1) to list, in rows, the broad types of land use, and in columns, their outputs and products or ‘What we get from land’. Not all cells in the matric are occupied, but where there was clear evidence of occupancy, the cell was identified by a colour and symbol (see later). 

Fig. 1 A matrix of land use types (e.g. wind power, livestock production, wild land) and products or ‘(what we get from the land’ (e.g. energy, food, peace of mind): the arrows indicate a cell where there is a strong connection or interaction between land use type and product.

The matrix evolved as topics of the Land Conversations were being developed – examples later.

Decision tree

The tree is a simple device which partitions various linked entities in a hierarchy that can be converted to a model using for example DEXi software. The tree has a main trunk – which might be a sustainable future for land use in the region, which divides into several main branches (perhaps Land Use types) which in turn divide into further subbranches and leaves. In a model the leaves and branches can be combined quantitatively to give the status at any point in the tree. Also, the tree can be interrogated, for example, to assess the extent to which current food supply can be satisfied by production.

Fig. 2  Decision tree of main land use types and sub-categories (rows in the matrix): each category can be rated in relation to delivering one or more ‘products’ and the ratings combined through utility functions.

The matrix and tree were used to help guide discussion towards a set of concrete topics that would form the basis of the  conversations.

Matrix of Land Use types and five groups of products from the land

The Land Use types were a highly restricted set, presented in the first two left-hand columns in Fig. 3. The products and outputs were designated in columns under the descriptors ‘What we get from land’ and ‘Why we need land’ and were distinguished in five groups: 1) products from the land, 2) economy and employment, 3) losses and pollution, 4) wildlife and shared space and 5) human wellbeing and perception.  Where there was a clear interaction between row and column a cell was identified by a colour and an asterisk (explained later).

With reference to the dimensions listed at the beginning, Basal states and Land Use types are combined in the left-hand columns, while ‘What we get from land’ is condensed into the five groups listed in the previous paragraph. What about the other dimensions? Governance and society appeared as additional columns to the right of the matrix (under headings Ownership/influence and Political/administrative). The very wide range of external impacts was simply alluded to by the row in grey at the bottom of the matrix.

Fig. 3 Land Use Matrix: colours and asterisks define cells where a strong interaction exists between Land Use type and ‘What we get from land’; further dimensions are indicated by the grey shaded area to the right (ownership / political) and the grey row at the bottom (external influences). Zoom in to read detail.

The intention was that each Land Conversation would concentrate on a sub-set of cells in the matrix, and it was also envisaged that connections between cells or groups of cells would become apparent during the discussion. An example of connected topics in one Conversation is given in Fig. 4 (note – using an earlier form of the matrix).

Fig. 4 Example to show indicative topics in one of the land conversations. Note: the matrix above was based on an earlier draft and differs in detail from the final version depicted in Fig. 3.

Topics covered in each Land Conversation

The central Land Conversations LC 2, 3, 4 and 5 were intended to cover many of the topics of interest. LC1 introduced the concept behind the event and LC 6 considered next steps.

To compare coverage by the four central conversations, the matrix was adapted in the following way: if a connection (i.e. a cell) was covered then its colour and asterisk (see Fig. 3) were both left in place; but if a connection was not covered, the colour was removed but the asterisk left in place. The resulting coverage is suggested in Fig. 5. The result is highly subjective – one person (GRS) listening and noting – but from these observations, each Land Conversation was distinct and the overall coverage fairly comprehensive.

Fig. 5 Main topics discussed during the central four Land Conversations (author’s perception): LC 2, spread across green (products), yellow (economy/employment), orange (losses/pollution) and grey (wildlife/shared space); LC 3, mainly yellow orange and grey; LC4, mainly blue (human wellbeing) and grey; LC5, spread wide but concentrating on integration (shown by yello, blue and grey boxes).

Inevitably, as the base for the Land Conversations was land and its usage, the earlier conversations tended to be confined to specific sectors, but as the Conversations progressed, rows and columns began to be considered as complete entities. In LC 5 in particular, the columns ‘rural economy / jobs’ and ‘rural repopulation / housing’ and the lowest row ‘integrated/local – multifunctional’ were examined more as a whole than as discrete cells (as indicated by the outlined boxes around each row or column.

Extending to higher dimensions

The use of a decision tree can allow – in principle – the incorporation of the additional dimensions listed at the beginning. This is a complicated procedure that so far has not been completed for the Conversations, but the example in Fig. 6 shows the scale and the potential. A tree depicts Land use types (rows of the matrix) and suggests connections to ‘What we get from the land’ (columns of the matrix). The resulting tree, if constructed in these two dimensions, would be highly complex. However, the challenge lies in incorporating the other dimensions.

Fig. 6 Land use matrix presented as a decision tree with examples to show how Land use type connects with ‘What we get from the land’.

Querying the tree

Trees of the general form in Fig. 6 can be operated in both directions. We can ask what is the present system status, defined by how far the current land use types produce adequate products and outputs.  Or we can define what would be the ideal status and then ask how would land use types or the activities in them have to change to deliver the desired status.

The Land Conversations showed without question the need to invoke the second of these two. Speaker after speaker emphasised that the current system is not fit for purpose, in that few of the needed products and outputs, in any of the five groups, are currently provided by the land.

As an example, the links in Fig. 6 for first groups of products (green boxes) are expanded slightly in Fig. 7 to illustrate the question of how the present status of dependence on imports for staple carbs, wood and natural fibre can be lessened or removed altogether. Even a cursory analysis would conclude that the present status is a result partly of internal land use decisions and partly of higher-dimensional (some very powerful, mostly negative) influences. To achieve the aims, the present Land Use types and activities within them would need to be rebalanced, but that rebalancing could only be achieved by a complete reorganisation of current governance and public attitudes.

Fig. 7 Decision tree extended to include Products from the Land and illustrating some additional dimensions that would need to be incorporated if import dependence was to be removed.

A major bar to progress is that current land use is highly sectorised throughout the dimensions. Vested interests compete to keep things as they are. The Integrated/local land use type, though small in area at present, is given some prominence in Fig. 7 because – as discussed in LC 5 and 6 in particular – it can manipulate and rearrange the different land uses and products towards a desired blend.

As a further indicative example, links are shown in Fig. 8 between Land Use types and another of the groupings under  ‘What we get from land’, this one being Losses and Pollution. The tree could be extended via biophysical processes to link Land Use types to the categories of loss and pollution. 

Fig. 8 Decision tree extended to show main negative influences on the four categories under Losses and Pollution.

Final remarks

The main aims of constructing a matrix and decision tree were to assist in the selection of topics in the SEDA Land Conversations.

  • It is stressed that the examples given in Figures 3 to 8 are indicative and not intended to be final or fixed. While the examples have concentrated on Products from the Land, or ‘plant production’ in the tree, the other Land use types can be extended as necessary.
  • Dexi decision tree software is easy to use by people and groups who might wish to elaborate on Fig. 3, etc., or construct a different version (search ‘Dexi’ & ‘Bohanec’ to get to Marko Bohanec’s IJS-Slovenia web site and downloadable programme). Dexi has been used extensively in collaborations between the Hutton and EU groups.
  • A matrix and decision tree were found useful as simple visual aids but there are many other modelling systems that may be more appropriate to handle the complexity of what is being examined and proposed.

Contact: geoff.squire@outlook.com

[Online 29 Jun 2021, minor edits 22 Apr 2022]

SEDA Land Conversations – first ideas

The Scottish Ecological Design Association has been progressing at pace with the organisation of their 6 Land Conversations. The first one will be held later today, details and booking at A New Vision for Land Use in Scotland.

Land use in Scotland and its immediate products are varied and spatially complex. They are influenced by matters of ownership and political will and a range of external agents of both human and natural origin. A matrix and decision tree are being developed as an aid to understanding the complexity.

[The tools were developed and updated during the conversations – later versions and examples of their use are given at SEDA Land Conversat-ons

Matrix

A matrix of land use and outputs is is intended both to help set the scene and to summarise discussion over the coming weeks. The matrix as it stands at 1200 today 1 March 2021 is shown below (Fig. 1).

Land use is divided into broad categories of energy, water, urban/industrial, wild land, rough grazing, grassland, arable land, integrated/local enterprise and forest/woodland. The columns represent a second major dimension – things that the land provides or imposes as a result of management acting within local constraints. Categories include products from the land, economy/employment, pollution/losses, wildlife/shared space and human wellbeing.

Other dimensions are indicated outside the matrix. There are factors of land ownership and political will (columns to the right, left unfinished at this stage) and external influences (grey row below). The external influences can be further divided into those that are caused mainly by human interventions, such as the import-exports balance, wars and blockades; and those that can be classed as natural phenomena, such as weather and climate, storms and volcanic eruption. Pervading the whole, but not included in the matrix as shown in Fig. 1 is the biophysical baseline – geological and climatic history, topography, soils and our location on the Atlantic fringe.

Fig. 1 Matrix of land use classes (listed left, in rows) and things provided by the land, which are not all positive (coloured blocks, columns). A further dimension of ownership and political will is indicated by the grey columns to the right and the complex and varied external influences are represented very simply by the grey row at the bottom. Click for a PDF to view detail, including notes.

Each cell in the matrix is given a simple provisional score from empty, indicating little relation between the land use type (rows) and the output (columns), and then *, ** or *** indicating increasing relation or effect.

At this stage, the categories in rows and columns and the scoring in the cells are provisional and for illustration only. They are expected to evolve during the course of the Land Conversations in the light of discussion, comments and new understanding. The development of the matrix will be charted here with acknowledgements to those who have contributed.

Decision tree: a semi-quantitative assessment tool

The matrix is also being converted to a decision tree in DEXi software [1]. Like the matrix it will evolve with the Land Conversations. An initial description showing land use categories as branches of a tree and the other dimensions listed to the right is shown in Fig. 2.

Fig. 2 Diagram to illustrate the use of decision tree software as a means of organising the multiple dimensions of land use. The tree to the left shows the land categories, slightly modified from Fig. 1. The other dimensions, including the columns from the matrix, ownership/political will, and the various human and natural external influences are listed to the right. Each of the Other Dimensions interacts with the land use tree at many points, and any one interaction will affect other aspects of land use and other dimensions. Click for a PDF of the above.

Acknowledgements | contributions
  • SEDA and in particular Gail Halvorsen and David Seel for continued interaction over the scope and use of the matrix.
  • Will McGee from Forest Policy Group for suggesting realistic categories for the forest/woodland land use types.
Sources | references

[1] Decision models in DEXi are widely used in ecology and system studies. DEXi from Marko Bohanec at the Josef Stefan Institute, Slovenia is available to download: DEXi: a programme for multi-attribute decision making

Contact: geoff.squire@hutton.ac.uk or geoff.squire@outlook.com

[Updates – 2 March with decision tree figure and 3 March with text edits.]

Land Conversations 2021

Scottish Ecological Design Association’s Land Conversations, spring 2021. Six online discussions on the future of land use in Scotland. Including all forms of land – urban, wild, agriculture, forestry, industry. A call for people to decide the future of land in Scotland. With some recollections of earlier work with SEDA.

Back in 2012, the Scottish Ecological Design Association (SEDA) got in touch with an invitation to join them at their annual meeting and give a presentation on some of our work on the state and future of land, particularly that used for agriculture [1]. The meeting proved to be a refreshing example of searching discussion by people with interests and professions that were mostly outwith the scientific disciplines typically associated with food and agriculture.

Following the meeting, Sam Foster from SEDA wrote an appreciative summary of the talk (left, click to see a larger version), then he and David Seel, also from SEDA, asked if we would edit an Issue of the SEDA magazine.

The issue came out in 2013 [2] and included articles from several Hutton Institute people, and also friends and collaborators in soils, ecological processes, human fallibility and their links to land use and food security (more on the issue below).

Land Conversations 2021

So David Seel’s call, seven years later, in autumn 2020, with a request to advise SEDA on their proposed series of online Land Conversations, brought back some of those memories. Over the last few months, there has been continued interaction with SEDA, mainly through Gail Halvorsen and David Seel, who are leading the Land Conversations project, and then with ex-colleagues from the Hutton Institute who will be offering their expertise. The programme for the Conversations is now published on the SEDA web site [3, and flyer below right], which gives more on the scope and purpose. Here’s why it appealed to me.

First, the coverage of land use is comprehensive. It included production land comprising agriculture, forestry, and rough grazing; wild land and rewilding; water, both visible on the surface and underground; but also urban land, industrial and residential, transport infrastructure including roads and rail, and then energy – wind, solar, hydro (fossil and nuclear coming under industry). This broad consideration will be particularly appealing to those (me included) who have repeatedly queried why even activities as close as agriculture and forestry have been treated separately in census, subsidy and planning.

https://www.seda.uk.net/land-conversations

Second, most people in SEDA, and their circle of related interests, are not specialists in food systems or land use, except where that cuts across architectural design. Yet they have an abiding interest in the future of the planet, and how things can be done differently. They also bring, in my experience to date, a professionalism and businesslike drive that derives from hi-tech, commercial business.

There is little difference, when it comes to the principles, between designing architecture and designing a food system or field [4].

The science of food and agriculture has tended to produce many reports and papers that summarise the present status and what needs to be done, but not enough (my view!) of integrated planning and putting that planning into practice. Special meetings and working groups, all charged with redefining policy, commonly achieve less that what is needed, often due to vested interests pulling in different ways.

There will be little progress until enough people come together to act and demand. The Conversations and their aftermath should make a major contribution to such progress.

In the meantime, some mild effort is going into structuring diagrams and decision trees based around each of the six Conversations (examples of which will appear on this site over the next few weeks).

The 2013 SEDA ISSUE on SOIL and natural capitaL

The conclusions of the talk at the SEDA AGM in 2012 were based on much field work on farm land, augmented by modelling and analysis over many years. The long history of agriculture and food production here was acknowledged, as was the diverse range of farming systems and the high productivity of the region, as good as anything else in north-west Europe. But the talk exposed threats due to the way some land is treated and to the dominance of external influences.

The field-based threats reside mainly in excessive intensification, which continued after the main phase of agricultural yield gain, 1960-1990, but with very little further increase in yield. The result was accelerating disruption of the essential cycles of energy and matter (carbon, nitrogen, phosphorus, etc.), leading to soil degradation, loss of functional biodiversity, and then loss of pollutants to water and to air as greenhouse gas emissions from both arable and livestock farming.

External influences arise from the pressures to serve national and international markets, ill-thought subsidy regimes and the late 1900s divorce between society and farming. The many consequences of such pressure included a degree of decoupling of much farming from food production, payment for destructive practices, money in the food chain going more to manufacturing and retail than the producer, and the country’s continued reliance on imports to guarantee food security.

Action needed at all scales

The solution required action at a wide range of scales, but the essential scale for future provision of food in decades and centuries to come must be that of the field. Fields must be treated not as an expendable workspace, but acknowledged as a complex ‘organism’, whose health and survival needs constant attention. Degrade the field and land will not feed the people when they next have to rely on it.

The choices may seem stark – but to continue as at present is not an option. There are many examples in Britain and abroad of very well managed land and rural enterprises that turn a profit [5]. One example that repeatedly comes to mind is a small tea plantation in Sri Lanka, visited in the 1991 [6]. The image below shows full ground cover of young tea, planted on mini-contours, shaded by several species and ages of tree. The trees provide shelter from sun and rain and most of them are legumes, fixing nitrogen from the air and otherwise stabilising and enriching the soil.

Contrast that with the field in the inset, not far away, in the same climate and on a similar slope, but ill-managed with no contouring and no cover, ensuring severely eroded soil and virtually no yield. In this case, the terminal state of this farmed land was due to poor management that had its origin in past politics.

The experience with SEDA in 2012 and 2013, including some joint writing with Sam Foster and David Seel, gave me a greater appreciation of ecological design in architecture. The understanding of the sun, the seasons and solar energy is an example – vital to modelling agricultural crops, grass and trees but also to the positioning of buildings and their windows [7].

The influence of architectural design and planning rubbed off onto our own research on design of ecological production systems. It strengthened my view of a system-first or system-led rather than innovation-led approach to the future of food production [8].

Sources / references / links / notes

[1] Presentation at the SEDA Annual General Meeting 2012: Design: crops, biodiversity and fragile ecosystems by G R Squire. Thanks to Mary Kelly for the kind invitation.

[2] SEDA Issue Spring 2013: Soil and Natural Capital. Available to members only. The issues contained articles from several Hutton Institute people including Cathy Hawes and Ed Baxter and also an appreciation of LEAF Linking Environment and Farming by GS. Page 2 of this article, in progress, will give a summary of the talk.

[3] A New Vision for Land Use in Scotland : 6 conversations – more at the Land Conversations pages of the SEDA web site.

[4] Design of arable and grassland systems based on bio-physical principles is far from new, being evident for example in the structuring of rig systems before 1700 and of multi-species grass-legumes mixtures in the 1800s. But by the end of intensification in the 1990s, the functioning and health of many fields in mainstream agriculture had been left to mis-chance, unsafe in the notion that they had been there for a long time and would remain however they were treated. Biophysical design continued to guide various ‘agro-ecological’ farming methods and increasingly does so, but they remain a minority. A well designed field has its main stores (of energy, carbon and plant nutrients) in balance and regulates fluxes between them, such that (for example) offtake is replenished and losses are minimal. Management achieves this by ensuring synergy and coexistence between the microbes, wild plants and invertebrates that determine the integrity of a field and the economic products (crops, grass, livestock) that they periodically sustain.

[5] One of the articles in the SEDA Issue of 2013 was on the early history and principles of LEAF Linking Environment and Farming. The James Hutton Institute, and the Scottish Crop Research Institute before it, was a LEAF Innovation Centre. LEAF is a broad church, with few rigid prescriptions, encouraging farming to move gradually to forms of sustainable management. The UK hosts a range of progressive farming organisations, some of which, including LEAF, will partake in the Land Conversations.

[6] For much of the 1980s and until 1992, self-employment in land use (measurement, assessment, recommendation) paid the bills. A visit to Sri Lanka to appraise some of the research there gave a unique opportunity to see some of the best (and the worst) of land management. But to be fair, the worst of land management can be found in almost any country.

[7] One of the most authoritative and accessible descriptions of the annual solar cycle, including the effects of the earth’s tilt and elliptical orbit round the sun, is given by an architect: Szokolay S.V. 1996 (rev 2007). Solar geometry. Passive and Low Energy Architecture International (PLEA) and Department of Architecture, University of Queensland.

[7] The contrast between innovation-led and system-led approaches to design was debated through EU projects such as AMIGA on environmental risk assessment. The prevailing approach to risk assessment was (and a to a large degree still is) innovation-led. An innovation such as a biotech crop or new crop-protection chemical is examined for its safety, but usually in comparison to current practice within an existing system. Such a comparison came to be considered (in our view) flawed if the existing system was itself not safe, for example if its soils and functional diversity were degrading. Far better then to define an ideal ‘safe’ system first and then consider which innovations would be needed to help move the existing system to this safe state.

Page 2 (in progress)