The latest Pesticide Use Survey for grass in Scotland presented by SASA [1] continues a line of meticulous reporting and analysis by the UK’s pesticide survey teams [2]. It allows the conclusions –
- the 2017 survey, published 2018 [1], found 3% of permanent and temporary grass was treated with pesticide, most of which was chemical weedkiller (herbicide);
- Scotland’s lowland farming areas comprise a mix of fields, some having no pesticide treatment (temporary and permanent grass) and others having very high pesticide treatment (arable);
- at the scale of the landscape, both the benefits and risks of pesticides depend on the proportions and spatial configurations of crops and grass;
- data from the EU’s Integrated Administration and Control System (IACS) for farm payments are now being used by the Agroecolgy group at the James Hutton Institute, Dundee, to estimate pesticide pressure in landscape mosaics.
This note summarises the latests SASA data, gives examples of landscape mosaics in east Scotland and argues that ‘low pesticide’ does not always imply ‘high biodiversity’.
Three broad categories of grass are considered in census records – permanent or long-term grass, temporary or rotational grass and rough grazing [3]. Permanent and temporary grass are both managed to support commercial grazing and offtake of hay or silage for feed [4]. Only 3% of these categories of grass was treated with pesticide in 2017 [1]. Rough grazing covers much of the higher land, is largely unfertilised and less than 0.5% of its total area was treated with pesticide [5].
Most of the pesticide applied to the 3% of permanent and temporary grass is chemical weedkiller (or herbicide). Those fields treated typically receive one herbicide formulation in a year. The three most widely used herbicides were MCPA, Fluroxypyr and Fluroxypyr/triclopyr, mainly for control of broadleaf weeds such as docks and thistles [1, 6]. Other herbicides such as glyphosate were applied over a much smaller area. The largest area treated with any formulation was the estimated 11,400 ha receiving MCPA. In total, 25 different herbicide formulations were recorded as being applied to grass in 2017, but all except the three cited above were applied to very small areas [1, Table 5 in report].

No treatment of fungal disease? In arable crops, fungicides tend to dominate pesticide usage. Yet very little of the area of grass was treated for fungal pathogens. Fungicide treatments to grass have even decreased compared to the survey in 2009 [1]. The very small area treated with herbicide and the almost negligible use of fungicide imply that most managed grass here gets no pesticide.
Questions now arise as to whether spatial groupings of grass fields create low- or zero-pesticide landscapes and whether the presence of grass among arable fields moderates the much higher pesticide applications to cereals, vegetables and potato. To resolve these questions, it is necessary to know the spatial variation in grass and arable land across the country and locally.
Distribution of permanent grass, temporary grass and arable
The categories of permanent and temporary grass co-occur with arable or ploughed land mainly in the east, but also across the central belt and to the west. Permanent grass is left without being ploughed for many years. Temporary or ‘rotational’ grass is sown, cultivated for a few years and then ploughed and sown with arable crops for a few years. The cycle is usually repeated.
The total area of crops and grass was 1,910,347 ha in the 2017 census [3], of which 31% was arable and 69% grass, but the mix of crops and grass is far from uniform from west to east (Fig. 1, bar chart).
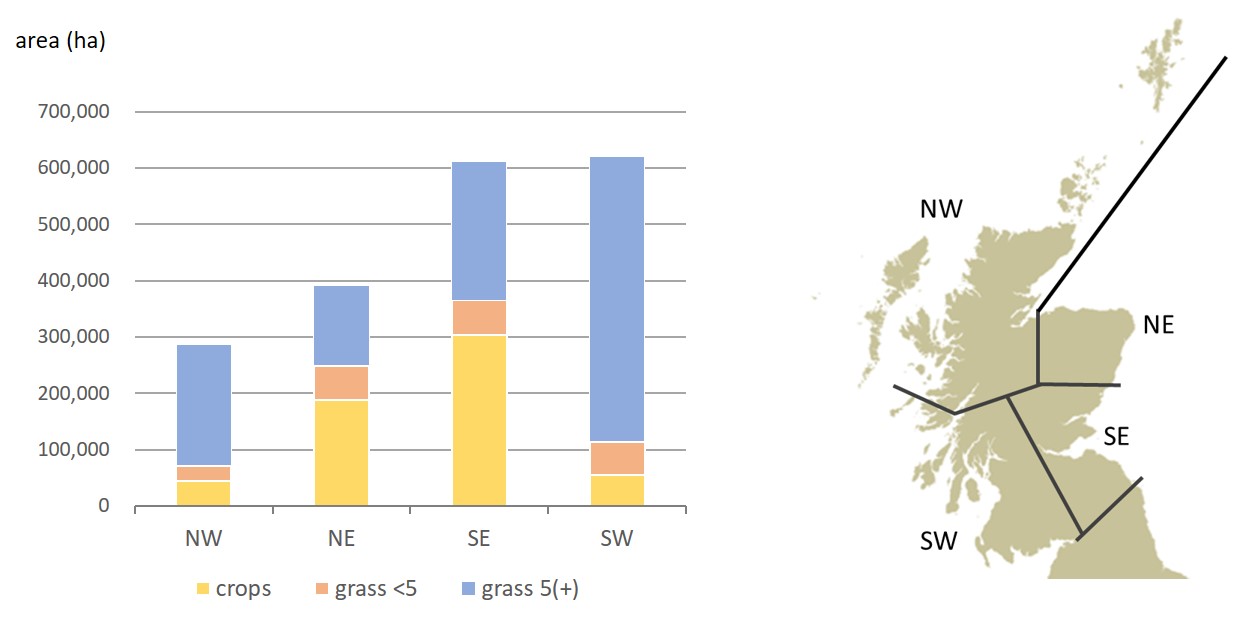
Fig. 1 Areas occupied by crops, grass under 5 years old (grass <5) and grass 5 years old and over(grass 5(+)) in the four regions shown right with simplified boundaries. Source: Economic Report for Scottish Agriculture 2016 and data for 2017 [3].
The north-west (NW) region has, despite its large area, the least of these three categories of land. The south-west (SW) and south-east (SE) have similar total areas of crops and grass, but the south-west (SW) has very much more permanent grass (grass 5 years and over) than the SE. The NE has similar proportions of grass and arable to the SE. The regions are indicated very approximately on the map in Fig. 1 – the actual boundaries between regions follow administrative units and can be viewed online in the Economic Report for Scottish Agriculture [3].
The varying balance of grass and arable in Fig. 1 is caused mainly by climatic differences between the wetter west (more grass) and the drier east (more arable). Most pesticides are used in the east because the climate there is dry enough for commercial growing of cereals, tubers and oilseeds.
Arable-grass landscape mosaics
Starting around the year 2000, it has been possible to map the configurations of crops and grass in the landscape using data from the EU’s Integrated Administration and Control System or IACS. A previous article on this site explains the method [8].
Results to date show that patches of land in the SE and NE regions are rarely all-arable or all-grass, but the proportions of arable and grass can differ widely between localities. Two representative landscapes are compared below (Fig. 2) as circles extracted from the much larger surrounding land mass. Each small shape within a circle is an agricultural field or a stretch of woodland. The average size of fields across the country as a whole is 7 ha, but fields under mainly arable cultivation tend to be larger than fields under grass.

Fig. 2 Contrasting eastern landscapes (showing differing proportions of grass (light green) and cereals (red, orange). Other colours: dark green, woodland; yellow and blue, arable but not cereal. The average field size in the country is about 7 ha.
The next step is to assign a pesticide application to each of the fields. Pesticide surveys are based on a sample of farms, then upscaled using the proportions of crops and grass in different zones around the country [1]. It is not possible therefore to assign either a total pesticide usage or an application of specific formulations to individual fields.
For the purpose of risk-benefit analysis, the likely or potential pesticide usage in fields can be assigned from a national or regional average based on fields sampled in the survey. These averages, which we usually call ‘nominal’ values offer a reliable first estimate of the degree to which landscape mosaics differ in pesticide applications. As described in Mapping pesticide loading spring cereals are typically treated with around 5 formulations, winter cereals around 10 and potato more than 20.
The landscape to the left in Fig. 2 is mostly grass (light shades of green) but with a few clusters of cereal fields (red, orange). Most fields will therefore not be treated but the red and orange fields will be treated with herbicides, fungicides and some insecticides.
The one on the right is mostly arable, again the cereals shown in red and orange. However, even in the densest arable areas, there is some grass that will not be treated with pesticide. There are also clusters of all-arable fields, each of which will get treated with between typically 5 and 20+ pesticide formulations annually depending on the crop. The formulations applied will differ between the crop-types. Therefore the red-orange-yellow clusters will be treated each year with a very wide range of active substances. (Details can be found in the Arable Crops surveys by SASA at the link given in [1].)

Management at the landscape scale – no easy solutions
As described in a related article Mapping pesticide loading, the IACS data can be used to define potential hot-spots of pesticide application in relation to defined ecological risks or the presence of non-target organisms such as wild plants and insects. Configurations of the type shown in Fig. 2 are also needed to develop advice on management of the landscape, for example in preparing ‘area-wide integrated pest management (IPM)’ or restoring biodiversity and its many positive functions. (More on this in a later article.)
However, simply manipulating pesticide treatment by altering the proportions of crops and grass at the scales in Fig. 2 will not by itself lead to enhanced or more stable farmland biodiversity. The main reason is that grass fields have come to support a different and generally lower plant biodiversity than the most diverse cropped fields. Disturbed cropland subject to ‘rotation’ or sequences of different crops has the capacity to hold a buried soil seedbank of up to 40 or 50 mainly uncompetitive broadleaf plant species, which if allowed to germinate and grow support much of the invertebrate food web in agriculture. In contrast, permanent grass has a different composition, both of its visible plant species and its seedbank.
A major obstacle to progress is that little is known of the species-composition of managed grass in the lowlands. It has not been a priority for research funding in recent decades. One thing is certain, however – most grassland today is very much less diverse than it was in the 1800s and early 1900s. Notably, legumes such as clovers and vetches have almost disappeared from managed grass, as have broadleaf (dicot) species. This unheralded decline is yet another major, long-term shift in the biodiversity of agricultural land and will be explored in the next article in this series.
Acknowledgement and credits
Contact: Geoff Squire geoff.squire@outlook.com / geoff.squire@hutton.ac.uk.
IACS analysis and geospatial mapping – Nora Quesada nora.quesada.pizarro@hutton.ac.uk and Graham Begg graham.begg@hutton.ac.uk.
Scottish Government provided funding to the James Hutton Institute to carry out the analysis of IACS data used in Fig. 2.
Sources, references, links
[1] Pesticide Usage in Scotland. Grassland and Fodder Crops 2017. By Monie C, Reay G, Wardlaw J, Hughes J. Science and Advice for Scottish Agriculture 0SASA) Edinburgh, at http://www.sasa.gov.uk/pesticides/pesticide-usage/pesticide-usage-survey-reports. Usage reports are compiled for chemical pesticides applied to crops and grass, not to livestock. See [9] for guidelines on sheep dip and other sources of pollution from animal husbandry.
[2] For Pesticide use surveys across the UK as a whole see Fera Science Limited: https://secure.fera.defra.gov.uk/pusstats/surveys/index.cfm.
[3] The latest agricultural census (2017) is summarised in the form of spreadsheets and graphs at Economic Report for Scottish Agriculture at https://www2.gov.scot/Topics/Statistics/Browse/Agriculture-Fisheries/PubEconomicReport. The full regional map is given online in the 2016 Report at https://www.gov.scot/publications/economic-report-scottish-agriculture-2016/ then navigate to ‘Geography and structure’.
[4] The designations permanent and temporary grass have changed at various times since the late 1800s. In the current statistics released by Scottish Government [3], the grass designations are ‘grass five years old and over’ and ‘grass under 5 years old’. Additional categories of ‘direct sown’ and ‘undersown’ grass, each occupying small areas, are recorded in the SASA pesticide survey.
[5] Land classed as Rough grazing in Scotland occupied 3,718,795 ha in the 2017 agricultural census which is 66% of the Utilisable Agricultural Area [see 6]. Of this total less than 0.5%, or about 14,000 ha, was treated with pesticide (sources in [1] above) including Asulam [6] used mainly to control bracken (granted as an emergency measure).
[6] For information on herbicides, e.g. MCPA http://sitem.herts.ac.uk/aeru/ppdb/en/Reports/427.htm and Asulam http://sitem.herts.ac.uk/aeru/ppdb/en/Reports/1551.htm.
[7] Most of the fungicide applied to grassland in the 2017 survey was on ‘undersown’ grass, which is usually the name given to grass sown so as to emerge and grow underneath a nurse crop such as a cereal. About 48% of undersown grass was treated and even here it was ‘for the control and prevention of disease on the nurse crop [1, page 11]’.
[8] Integrated Administration and Control System, IACS: data became available from the EU’s IACS system from around 2000. The use of IACS data is described at Mapping pesticide loading.
[9] For information on sheep dip and other potential environmental hazards from livestock farming: see the SEPA (Scottish Environment Protection Agency) web pages at https://www.sepa.org.uk/regulations/land/agriculture/sector-specific-issues.