Back in 2011, several people at the James Hutton Institute were working to develop a general ‘systems’ approach to measuring and modelling managed ecosystems [1]. We constructed a diagram to place and connect the main components of the system and the internal and external forces that influence its workings.
The framework diagram was used and adapted for various purposes in the following years [2], and has recently been re-interpreted for a book chapter to be published 2024 on the role of biodiversity in supporting agriculture [3].
We thought the original diagram should be available so collaborators could appreciate where the structure originated and how it evolved. Here it is. The main author was Cathy Hawes.
Here are some explanatory notes dated 16 August 2011:
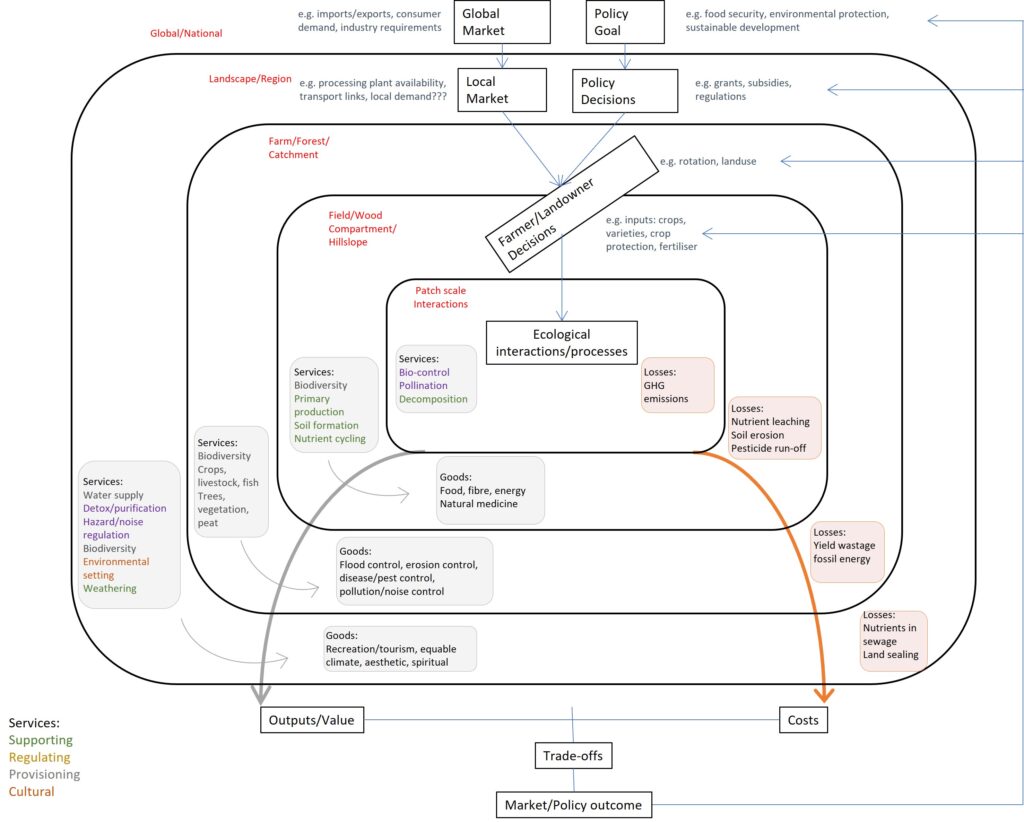
“This diagram represents an initial stab at describing the context, the likely main elements and the scale of a generic ecosystem services framework. It is intended only to kick off discussion and is by no means a final approach to the problem!
“It starts off at a global or national scale influenced by global food/fuel/fibre markets and national policy goals (e.g. food security, biodiversity, sustainable development). These factors influence local markets and specific government policies at the regional or landscape scales. These, in turn affect farmer/landowner decisions and behaviour at the local scale. Finally, the end result is the impact on the interactions between individual organisms within a management unit (field, forest or hillslope).
“It is these interactions between organisms that produce many of the ecosystem services that are required for sustainability. The goods and services included in the boxes at each scale are taken directly from the National Ecosystem Assessment, but we will need to agree exactly where they should sit in the system and whether there are others that should also be included.
Balanced against these goods and services (benefits) are losses from the system or costs. Analysis of the trade-off between costs and benefits resulting from a particular policy/market goal then feed back to decisions made at each scale.”
Contact: cathy.hawes@hutton.ac.uk
Sources | links

[1] Research funding from the Scottish Government to the James Hutton Institute.
[2] The framework was used in EU projects to interpret multi-scale phenomena. For example, a much simplified version was published in the final report of the EU AMIGA in 2016.
[3] The diagram has been adapted for a book chapter to be published in 2024: Squire GR, Hawes C. Biodiversity for Agriculture: the role of integrated farm management in supporting agricultural production through biodiversity. Details to follow.