The SEDA Land Conversations, online in March and April 2021, have taken place and the report on them is due in June. Updated matrix and decision tree, used to guide content and summarise developments, are described here.
The series of SEDA Land Conversations – A New Vision for Land Use in Scotland – was held online between 1 March and 12 April 2021. This post updates a previous description of the matrix and decision tree that were used to define the scope of the conversations.
SEDA’s approach for assistance with the Conversations at the end of 2020 was welcomed in a previous post – Land Conversations 2021 – which related some interactions with SEDA several years ago.
Introduction
Two simple devices were used to assist development of the Land Conversations: a 2-D matrix and a decision tree. Each of these depicted connections between two of the several ‘dimensions’ through which land use operates and can be influenced:
- Basal states (topography, soil, climate)
- Land Use types
- Outputs and products from the land – ‘What we get from land’
- Governance and society (often two separate dimensions) including ownership, public needs, power balance, political will
- External influences – mainly human causes – including global food system, import dependence, and then blockade, war, global pollution.
- External influences – mainly ‘natural’ – e.g. volcanic eruption, mass-transfer by air.
These dimensions are presented for illustration here – they are not all-encompassing, not fixed. The first three in the list tend to be directly connected, in that Outputs and products depend much on basal states but can also influence basal states (e.g. several thousand years of deforestation, two decades of growing potato).
Matrix
A spreadsheet was constructed (Fig. 1) to list, in rows, the broad types of land use, and in columns, their outputs and products or ‘What we get from land’. Not all cells in the matric are occupied, but where there was clear evidence of occupancy, the cell was identified by a colour and symbol (see later).
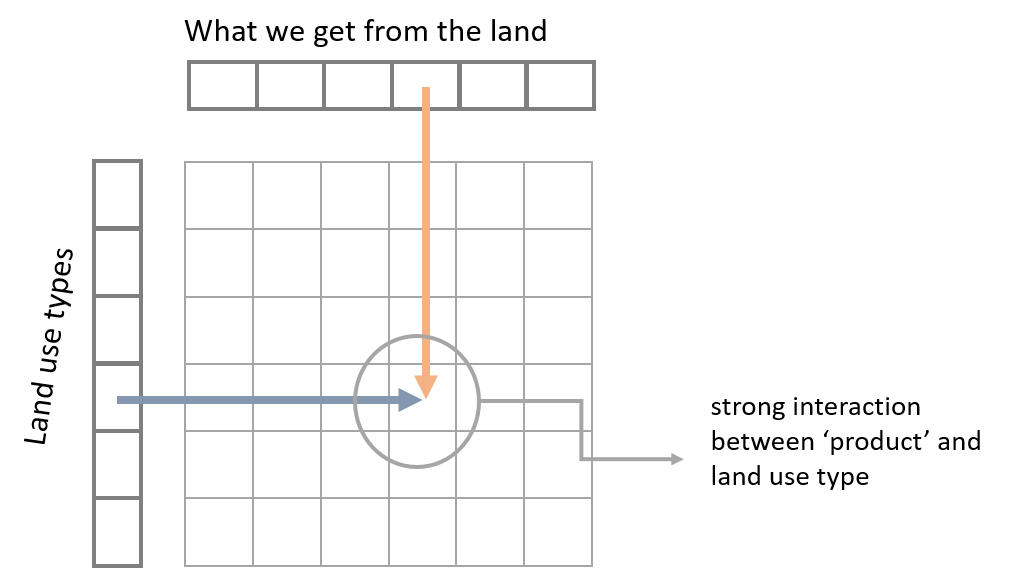
Fig. 1 A matrix of land use types (e.g. wind power, livestock production, wild land) and products or ‘(what we get from the land’ (e.g. energy, food, peace of mind): the arrows indicate a cell where there is a strong connection or interaction between land use type and product.
The matrix evolved as topics of the Land Conversations were being developed – examples later.
Decision tree
The tree is a simple device which partitions various linked entities in a hierarchy that can be converted to a model using for example DEXi software. The tree has a main trunk – which might be a sustainable future for land use in the region, which divides into several main branches (perhaps Land Use types) which in turn divide into further subbranches and leaves. In a model the leaves and branches can be combined quantitatively to give the status at any point in the tree. Also, the tree can be interrogated, for example, to assess the extent to which current food supply can be satisfied by production.
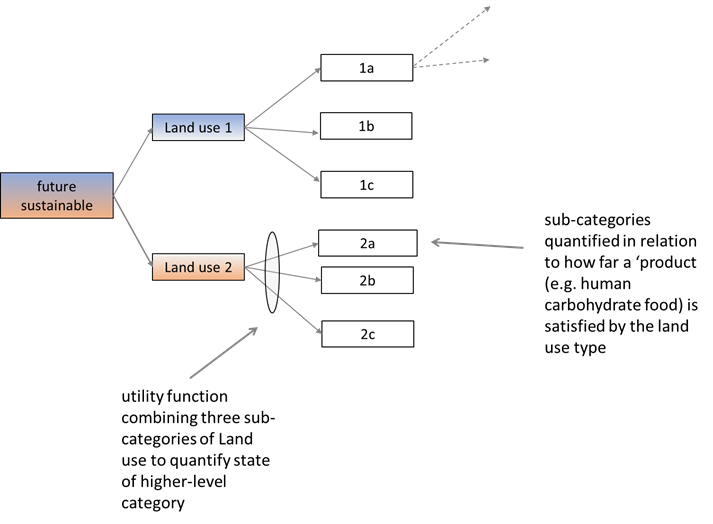
Fig. 2 Decision tree of main land use types and sub-categories (rows in the matrix): each category can be rated in relation to delivering one or more ‘products’ and the ratings combined through utility functions.
The matrix and tree were used to help guide discussion towards a set of concrete topics that would form the basis of the conversations.
Matrix of Land Use types and five groups of products from the land
The Land Use types were a highly restricted set, presented in the first two left-hand columns in Fig. 3. The products and outputs were designated in columns under the descriptors ‘What we get from land’ and ‘Why we need land’ and were distinguished in five groups: 1) products from the land, 2) economy and employment, 3) losses and pollution, 4) wildlife and shared space and 5) human wellbeing and perception. Where there was a clear interaction between row and column a cell was identified by a colour and an asterisk (explained later).
With reference to the dimensions listed at the beginning, Basal states and Land Use types are combined in the left-hand columns, while ‘What we get from land’ is condensed into the five groups listed in the previous paragraph. What about the other dimensions? Governance and society appeared as additional columns to the right of the matrix (under headings Ownership/influence and Political/administrative). The very wide range of external impacts was simply alluded to by the row in grey at the bottom of the matrix.

Fig. 3 Land Use Matrix: colours and asterisks define cells where a strong interaction exists between Land Use type and ‘What we get from land’; further dimensions are indicated by the grey shaded area to the right (ownership / political) and the grey row at the bottom (external influences). Zoom in to read detail.
The intention was that each Land Conversation would concentrate on a sub-set of cells in the matrix, and it was also envisaged that connections between cells or groups of cells would become apparent during the discussion. An example of connected topics in one Conversation is given in Fig. 4 (note – using an earlier form of the matrix).
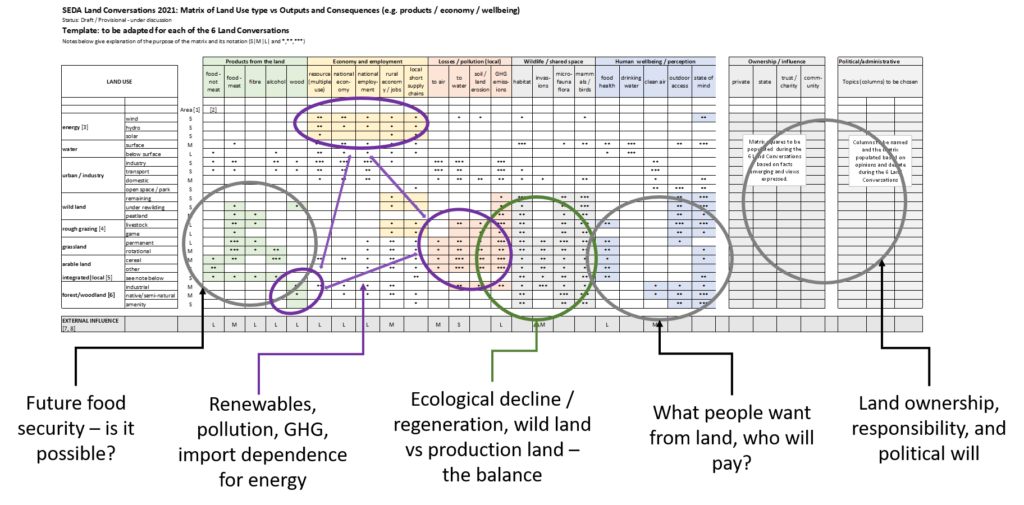
Fig. 4 Example to show indicative topics in one of the land conversations. Note: the matrix above was based on an earlier draft and differs in detail from the final version depicted in Fig. 3.
Topics covered in each Land Conversation
The central Land Conversations LC 2, 3, 4 and 5 were intended to cover many of the topics of interest. LC1 introduced the concept behind the event and LC 6 considered next steps.
To compare coverage by the four central conversations, the matrix was adapted in the following way: if a connection (i.e. a cell) was covered then its colour and asterisk (see Fig. 3) were both left in place; but if a connection was not covered, the colour was removed but the asterisk left in place. The resulting coverage is suggested in Fig. 5. The result is highly subjective – one person (GRS) listening and noting – but from these observations, each Land Conversation was distinct and the overall coverage fairly comprehensive.
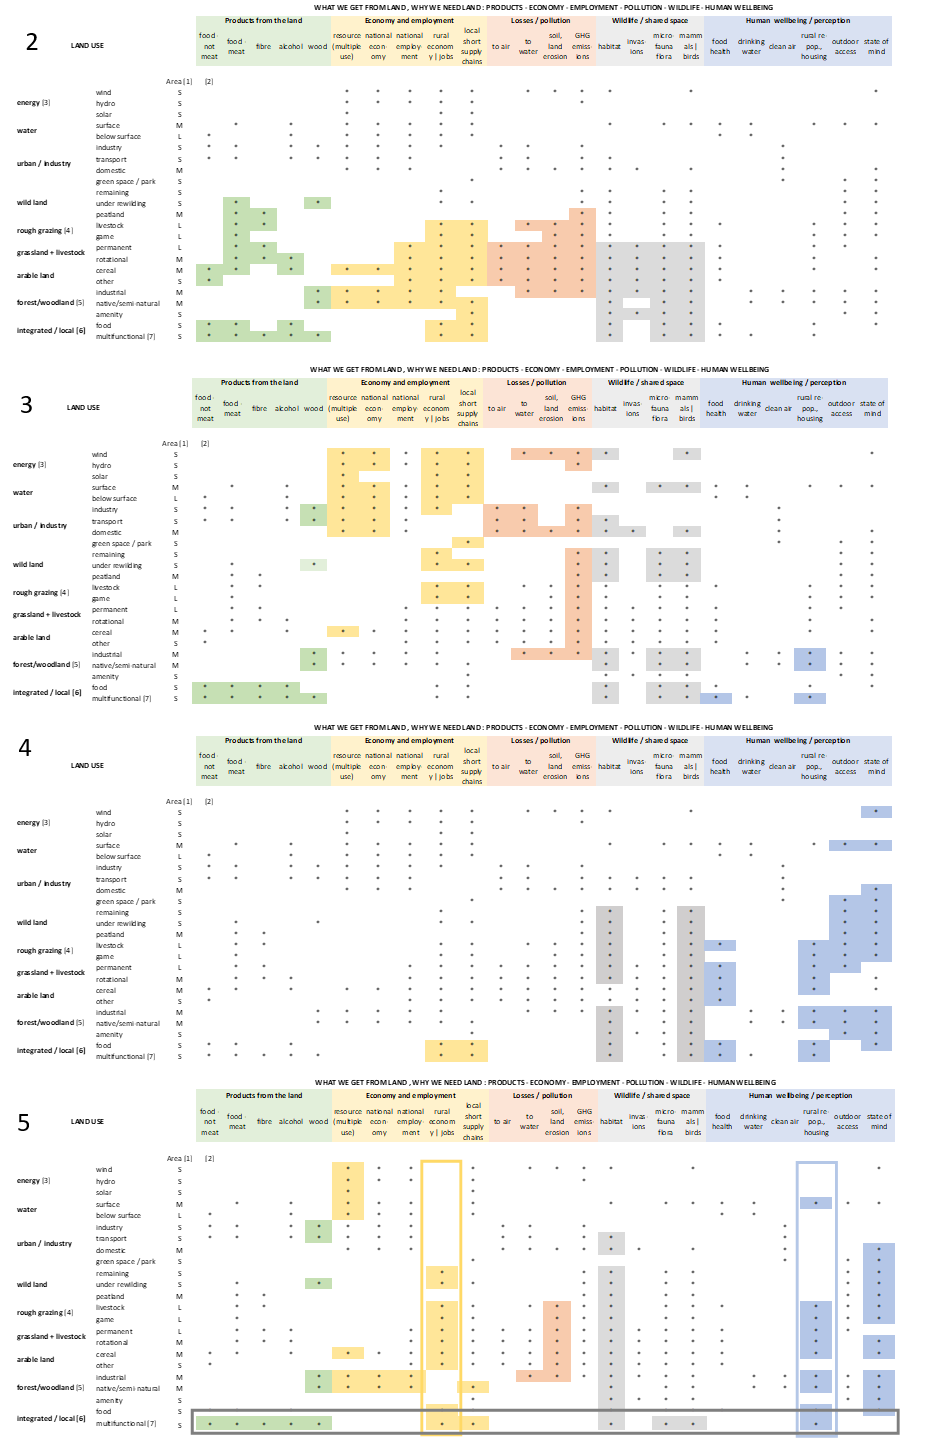
Fig. 5 Main topics discussed during the central four Land Conversations (author’s perception): LC 2, spread across green (products), yellow (economy/employment), orange (losses/pollution) and grey (wildlife/shared space); LC 3, mainly yellow orange and grey; LC4, mainly blue (human wellbeing) and grey; LC5, spread wide but concentrating on integration (shown by yello, blue and grey boxes).
Inevitably, as the base for the Land Conversations was land and its usage, the earlier conversations tended to be confined to specific sectors, but as the Conversations progressed, rows and columns began to be considered as complete entities. In LC 5 in particular, the columns ‘rural economy / jobs’ and ‘rural repopulation / housing’ and the lowest row ‘integrated/local – multifunctional’ were examined more as a whole than as discrete cells (as indicated by the outlined boxes around each row or column.
Extending to higher dimensions
The use of a decision tree can allow – in principle – the incorporation of the additional dimensions listed at the beginning. This is a complicated procedure that so far has not been completed for the Conversations, but the example in Fig. 6 shows the scale and the potential. A tree depicts Land use types (rows of the matrix) and suggests connections to ‘What we get from the land’ (columns of the matrix). The resulting tree, if constructed in these two dimensions, would be highly complex. However, the challenge lies in incorporating the other dimensions.
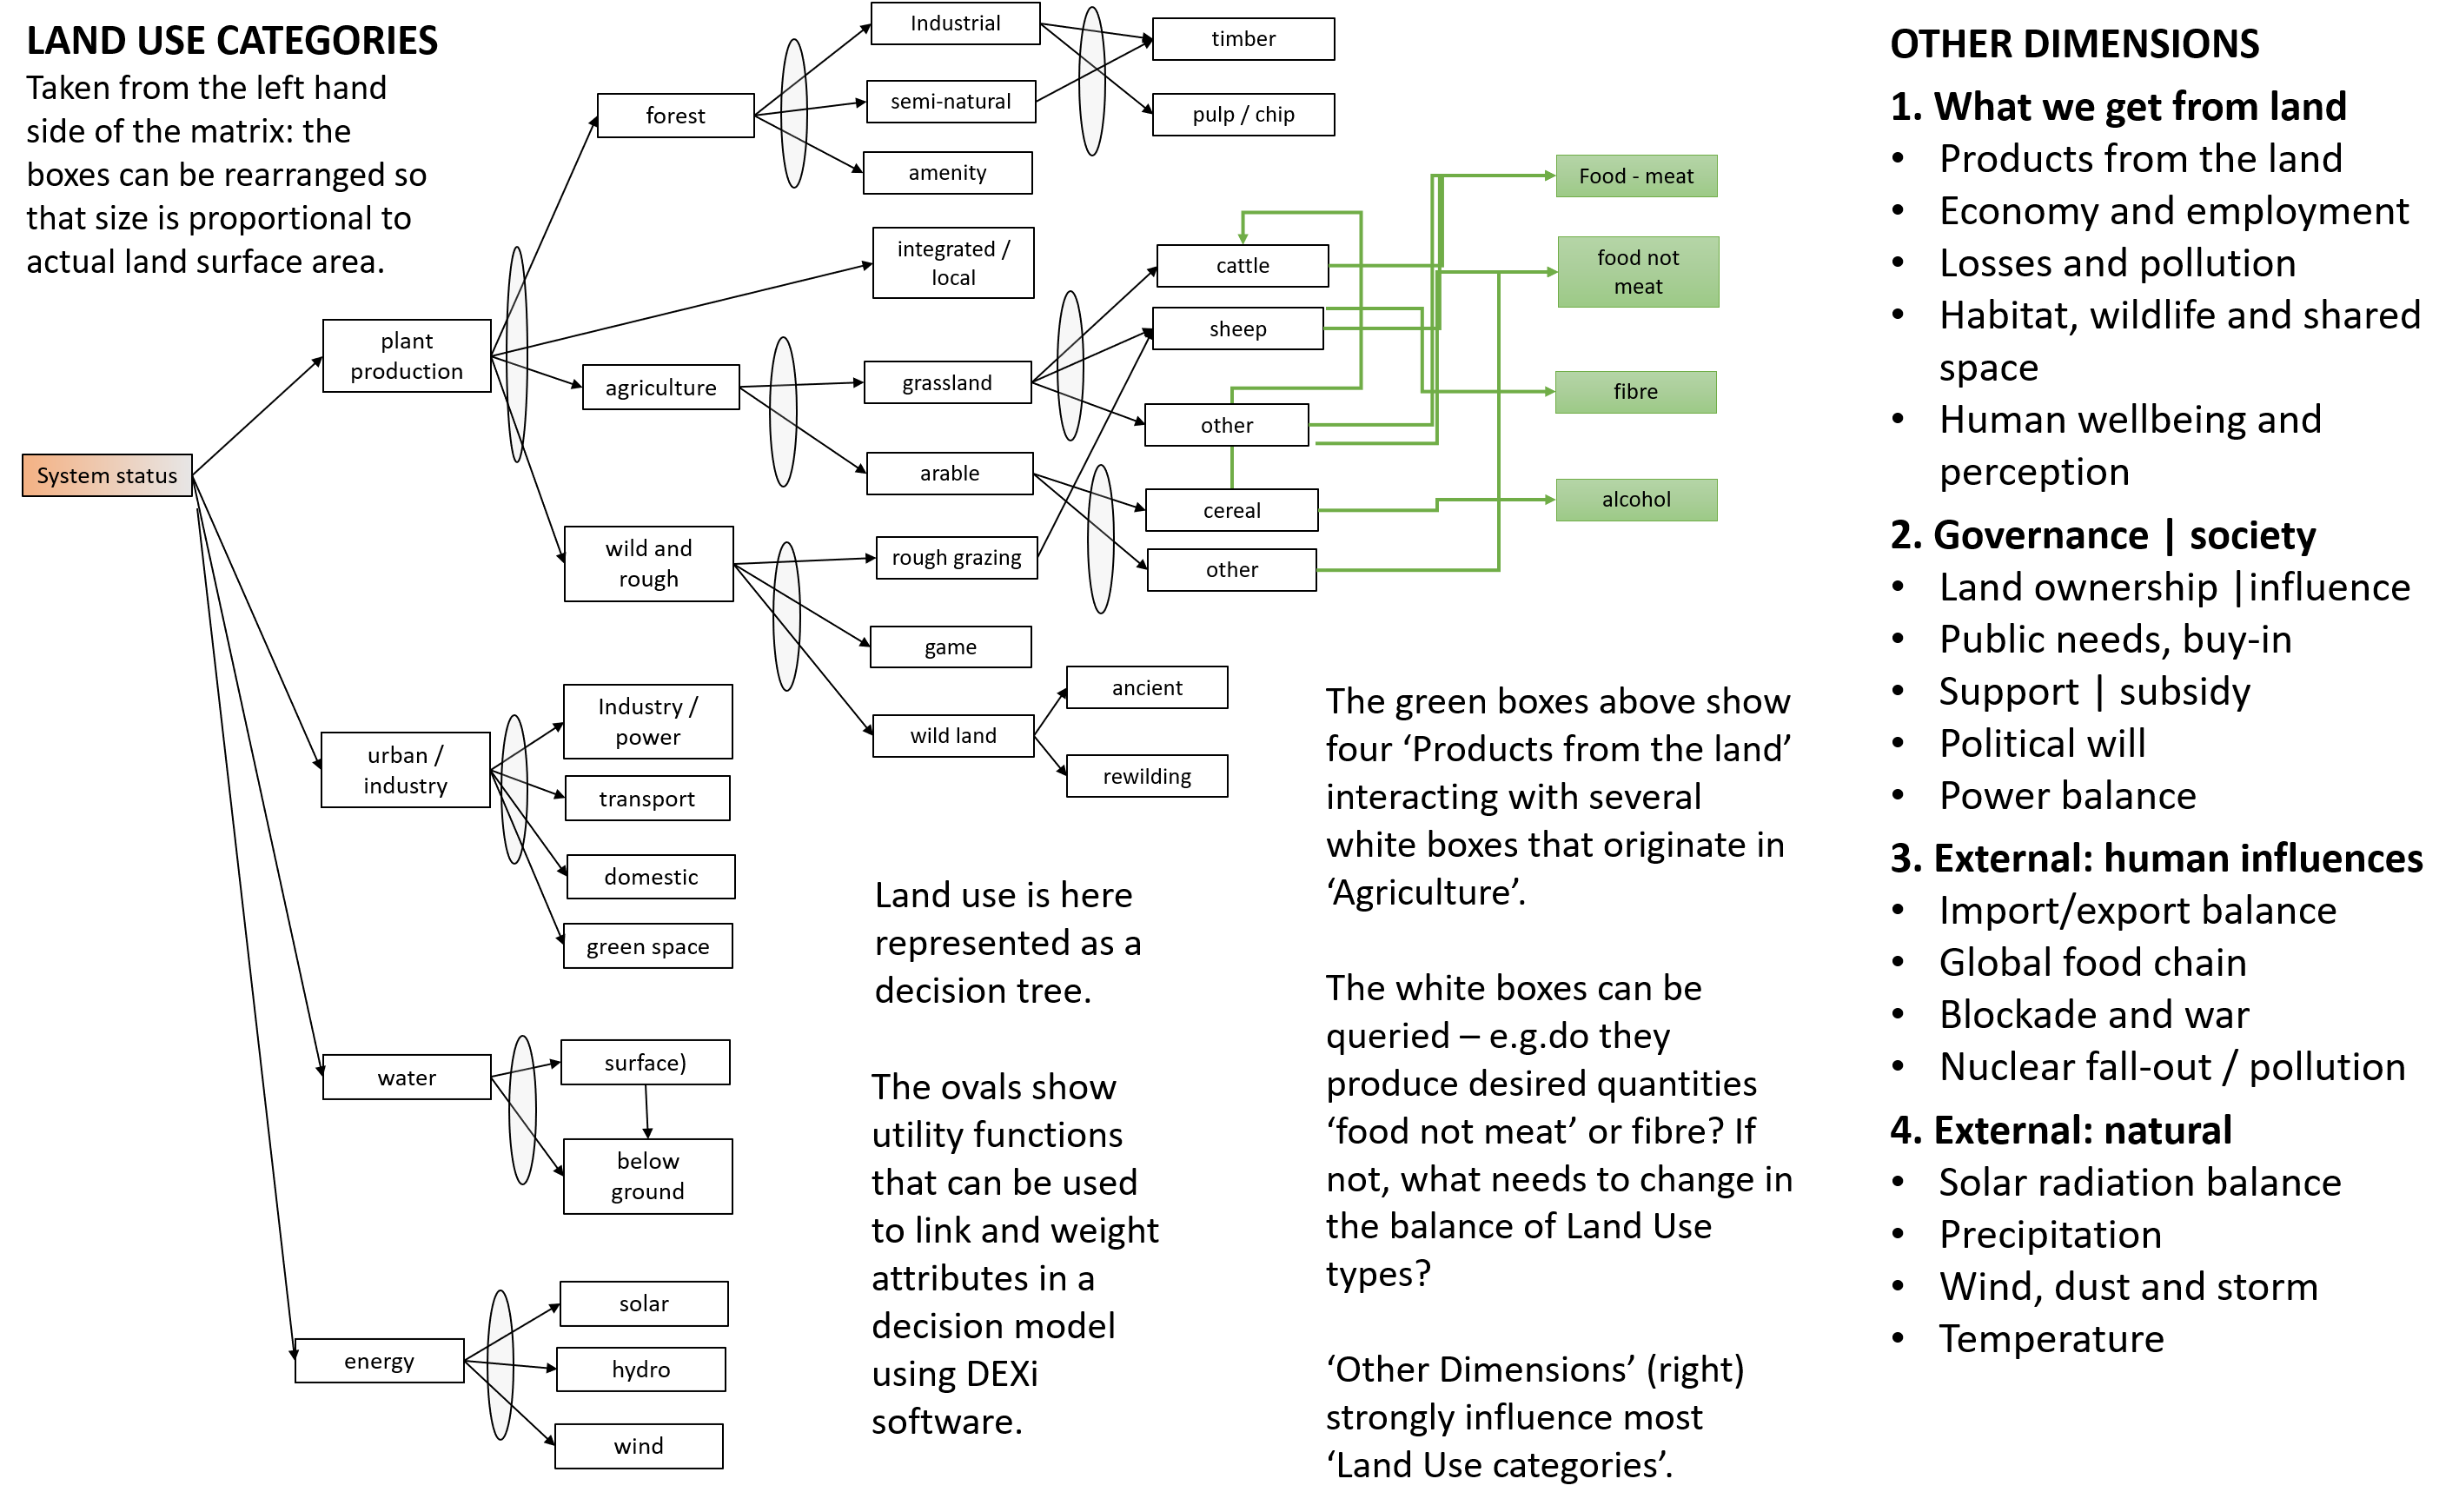
Fig. 6 Land use matrix presented as a decision tree with examples to show how Land use type connects with ‘What we get from the land’.
Querying the tree
Trees of the general form in Fig. 6 can be operated in both directions. We can ask what is the present system status, defined by how far the current land use types produce adequate products and outputs. Or we can define what would be the ideal status and then ask how would land use types or the activities in them have to change to deliver the desired status.
The Land Conversations showed without question the need to invoke the second of these two. Speaker after speaker emphasised that the current system is not fit for purpose, in that few of the needed products and outputs, in any of the five groups, are currently provided by the land.
As an example, the links in Fig. 6 for first groups of products (green boxes) are expanded slightly in Fig. 7 to illustrate the question of how the present status of dependence on imports for staple carbs, wood and natural fibre can be lessened or removed altogether. Even a cursory analysis would conclude that the present status is a result partly of internal land use decisions and partly of higher-dimensional (some very powerful, mostly negative) influences. To achieve the aims, the present Land Use types and activities within them would need to be rebalanced, but that rebalancing could only be achieved by a complete reorganisation of current governance and public attitudes.

Fig. 7 Decision tree extended to include Products from the Land and illustrating some additional dimensions that would need to be incorporated if import dependence was to be removed.
A major bar to progress is that current land use is highly sectorised throughout the dimensions. Vested interests compete to keep things as they are. The Integrated/local land use type, though small in area at present, is given some prominence in Fig. 7 because – as discussed in LC 5 and 6 in particular – it can manipulate and rearrange the different land uses and products towards a desired blend.
As a further indicative example, links are shown in Fig. 8 between Land Use types and another of the groupings under ‘What we get from land’, this one being Losses and Pollution. The tree could be extended via biophysical processes to link Land Use types to the categories of loss and pollution.

Fig. 8 Decision tree extended to show main negative influences on the four categories under Losses and Pollution.
Final remarks
The main aims of constructing a matrix and decision tree were to assist in the selection of topics in the SEDA Land Conversations.
- It is stressed that the examples given in Figures 3 to 8 are indicative and not intended to be final or fixed. While the examples have concentrated on Products from the Land, or ‘plant production’ in the tree, the other Land use types can be extended as necessary.
- Dexi decision tree software is easy to use by people and groups who might wish to elaborate on Fig. 3, etc., or construct a different version (search ‘Dexi’ & ‘Bohanec’ to get to Marko Bohanec’s IJS-Slovenia web site and downloadable programme). Dexi has been used extensively in collaborations between the Hutton and EU groups.
- A matrix and decision tree were found useful as simple visual aids but there are many other modelling systems that may be more appropriate to handle the complexity of what is being examined and proposed.
Contact: geoff.squire@outlook.com
[Online 29 Jun 2021, minor edits 22 Apr 2022]