James Hutton Institute, Dundee, UK: Geoff Squire, Cathy Hawes, Gillian Banks, Linda Ford, Tracy Valentine, Mark Young, Contact: geoff.squire@hutton.ac.uk
Featured case study: Knock Farm, Roger Polson
Towards an Atlantic regional hub for sustainability R&D
An update on aims and progress with examples to coincide with the Royal Northern Agricultural Society’s EcoAgriTech event at Knock Farm near Huntly.
Introduction
The sustainability of food production systems and landscapes is a global priority. The lowland arable-grass agriculture of Scotland’s Atlantic coast presents a significant regional study, unique in its diversity, high yield potential and landscape complexity. The James Hutton Institute has been developing the arable-grass as an Atlantic regional R&D hub to stimulate and enable collaboration with expertise in Boreal, Mediterranean, Continental and Balkan regions across Europe.
The aims are to establish a sound baseline through a wide range of biophysical and economic indicators, define sustainable states, assess the current direction of change and where necessary initiate remedial action. An essential part of the effort and expertise is contributed by farmers who allow access to their fields and landscapes for monitoring and experiment. Here, we summarise data collection on soils and seedbanks as a case study for Knock Farm near Huntly.
Methods
The region has been sampled and analysed since a first field survey in 2007. The structure of fields and their locality, the crops and weeds, the agronomy, invertebrates and the vegetation of field margins were examined in over 100 fields from the Black Isle to the Borders. Soil was taken and assessed for biophysical quality, including particle size, carbon (C) and nitrogen (N) content, C:N ratio, water holding capacity, bulk density, penetrability, pH and pore space. The samples were processed to assess the buried weed seedbank – a useful indicator of field biodiversity and farming intensity. Return visits were made to selected sites to assess change over time. Methods are described in Publications.
Soil and seedbank indicators
Of the biophysical attributes measured in the surveys, those defining soil quality and seedbank diversity are among the most instructive. Soil indicators differ greatly among sites. To demonstrate the range, the data for each attribute are summarised in the form of frequency histograms, presented for two soil variables in Fig. 1. The horizontal axis gives the range of values divided into intervals (the upper limit of each is labelled), while the vertical axis shows the percentage of sites in each interval.
Taking soil carbon (C, % by weight) for example, the highest proportion of sites occurs between 1.5 and 2.5%, but there are some very low values and a long higher tail of a few sites stretching to more than 6%. The spread shows that many soils, such as those around 2.5% are in moderately good health, but some soils have a low content below 1.5% and are in danger of erosion and loss of function, including capacity to yield. The other histogram shows water holding capacity (field capacity), higher values indicating a soil can hold more water when fully wetted and allowed to drain. During drought, crops in those fields at the lower end of the range will suffer water stress more quickly.
Fig. 1 Frequency histograms for all sites of soil % carbon and field (water holding) capacity. The arrows indicate values for fields sampled at Knock Farm.
The seedbank of buried ‘weed’ seeds has a dual role in cropland ecology. Too many injurious weeds are damaging to yield. But too few of the beneficial weeds will limit the cropland’s ability to sustain food webs that in turn mediate essential processes such as breakdown of organic matter, nitrogen transformations, pest regulation and pollination. Arable seedbanks are generally manageable if they contain 3,000 to 9,000 seeds per square metre (of field surface to a depth of 20 cm). Below 2,000 and they tend to hold too few beneficial species. Above 9,000 and their weed burden becomes difficult to control. These numbers might sound high, but they were much higher, typically 10,000 to 100,000 per square metre, in the first half of the 20th century.
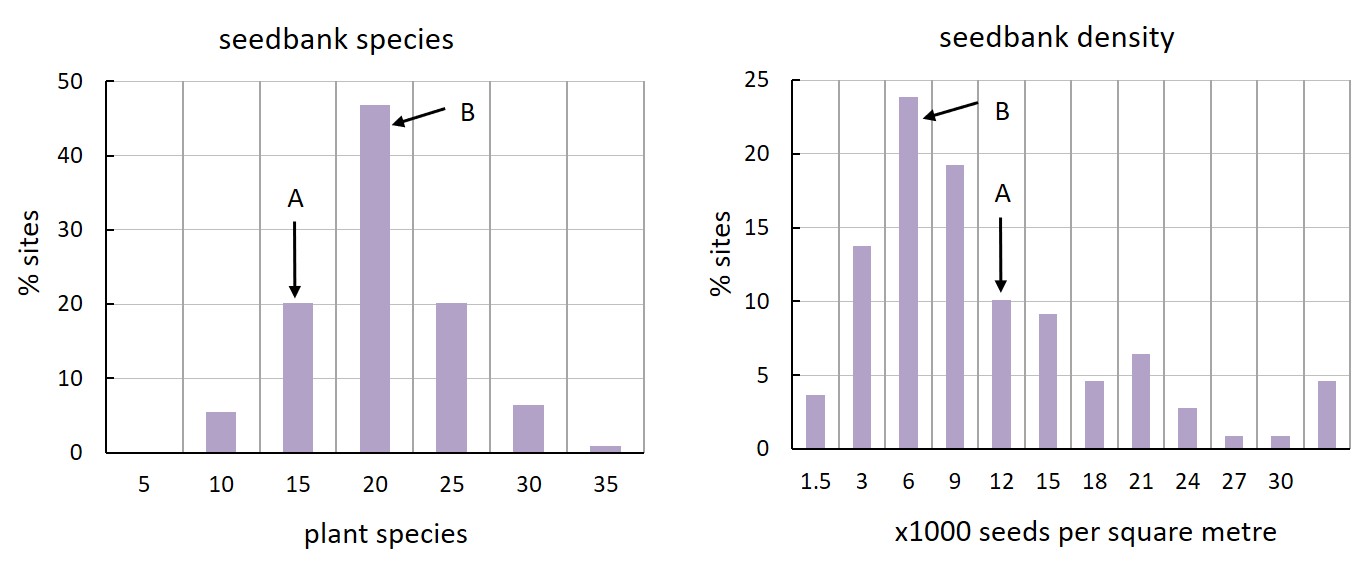
Seedbanks are usually dominated by a few species but contain others at low density. Seedbanks that can sustain a diverse in-field food web typically contain 15-25 species, ideally in an equitable balance.
Fig. 2 Frequency histograms for all sites of the number of plant species in seedbank samples and the number of seeds per unit field area. The arrows indicate values for fields A and B sampled at Knock Farm. Text box below gives explanation.
Case study: Knock Farm, Huntly (Roger Polson)
Two fields were sampled at Knock Farm. They were very similar in terms of soil attributes. In Fig. 1, the location of the fields on each histogram is shown by the single arrow. Fields were well above average in soil carbon and near the top of the range in field capacity. The fields also came out near the top in most other soil quality variables, including bulk density and porosity (air space).
The fields differed in their seedbank, probably indicating either a difference in previous management or local conditions. Seed numbers of all species combined (10 to 15) in Field A were in the range 9000-12,000 per square metre and the seedbank was dominated by one species at very high density, chickweed (Stellaria media). The other, Field, B, was far less dominated: it had fewer seeds and more species, almost an ideal combination.
Each year, weeds emerge from a seedbank but hardly ever in direct proportion to the species present. Here, Field A also had a higher density of emerged weeds in 2007, but the dominant species was annual meadow grass (Poa annua). On a subsequent sample in 2014, both Poa annua and Stellaria media were still the commonest weeds, but other species, bringing diversity to the food web, were hemp-nettles (Galeopsis species) and redshank (Persicaria maculosa).
Conclusions and progress to date
- Field surveys in eastern, lowland Scotland are providing baseline data to characterise an Atlantic zone hub in sustainability R&D.
- Time trends are being assessed by measuring factors in the same locations in different years.
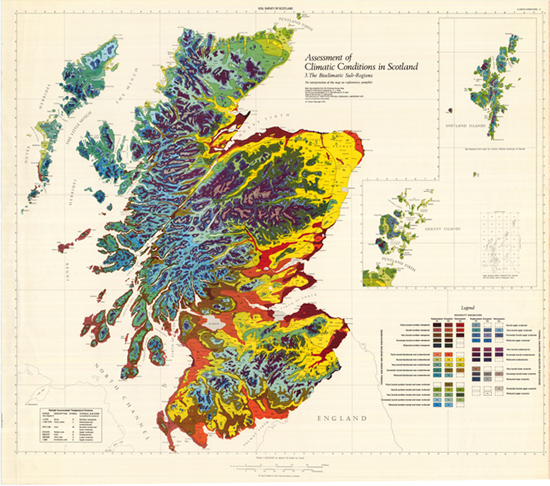
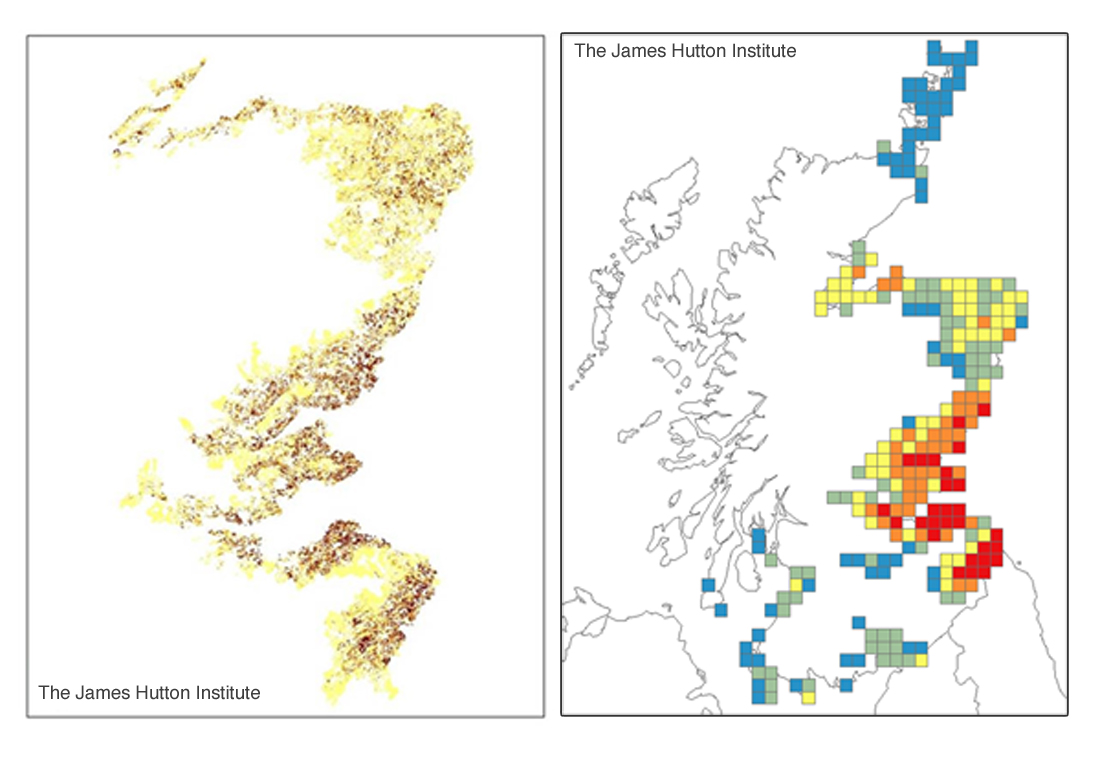
- Information collected at field and farm scales is being aligned with national inventories and mapping of soil, climate and land use.
- The baseline can be used to rate and rank fields and practices on individual holdings, as shown here for Knock Farm, near Huntly.
Acknowledgements
The original survey in 2007 was managed jointly by TJHI and SRUC in a major project funded by Scottish Government as part of the Sustainable Crop Systems Programme 2006-2011. Soil and seedbank attributes were measured at TJHI’s laboratories. Subsequent sampling up to 2015 was also funded by Scottish Government.
Publications
Hawes C, Squire GR, Hallett PD, Watson C, Young M. 2010. Arable plant communities as indicators of farming practice. Agriculture Ecosystems and Environment 138:17–26.
Squire G R. 2017. Defining sustainable limits during and after intensification in a maritime agricultural ecosystem. Ecosystem Health and Sustainability 3; doi.org/10.1080/20964129. 2017.1368873.
Squire G R, Hawes C, Valentine T A, Young M W. 2015. Degradation rate of soil function depends on trajectory of agricultural intensification. Agriculture Ecosystems and Environment 202:160–167.
Valentine TA, Hallett PD, Binnie K, Young MW, Squire GR, Hawes C, Bengough AG. 2012 Soil strength and macropore volume limit root elongation rates in many UK agricultural soils. Annals of Botany 110:259-270.
Young M W, Mullins E, Squire G R. 2017. Environmental risk assessment of blight resistant potato: use of a crop model to quantify nitrogen cycling at scales of the field and cropping system. Environmental Science and Pollution Research 24:21434–21444.