Resilience in a three-grain production system

Summary 

Cereal farming in the north Atlantic region improved to a point in the mid 1900s where starvation and famine were a distant memory. Half a century on from then, impending pressures through soil, climate and economics are threatening stable and reliable grain production. Yet the dire predictions of some commentators are unlikely to happen. Cereal farming has repeatedly adapted and survived since the first settlers brought grain to these islands.

This article summarises the changes that have occurred over the past century and suggests the system has in-built resilience through its combination of three grains – oat, barley and wheat. 

Cereal country, Scottish Borders, August during harvest (@curvedflatlands)

Cropland in the northern part of the British Isles has grown barley, wheat and oat as its main cereal grains for thousands of years. Barley and wheat have been recorded since the neolithic, oats perhaps later. Cultivation of all three has sustained people and had been demonstrably sustainable, in that it continues.  There is no reason in principle why it should not continue well into the future.

Until the mid-1900s, these three home-grown grains were the main food of people and livestock. Other crops such as rye have occupied little area. However, at no time were the areas or proportions or uses of these crops fixed. Rather, they have changed as part of long term societal trends and over shorter time scales in response to international markets and bad-weather years.

In 1900, oats dominated. Then the next 100 years saw major changes in the proportional area of the three cereals (Fig. 1).

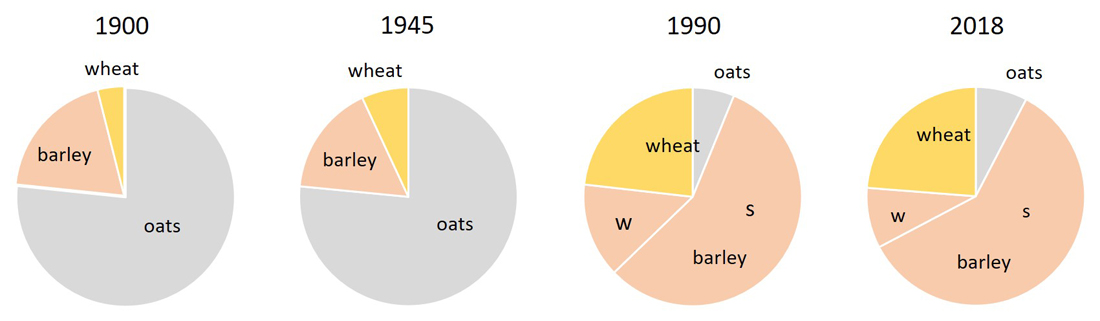
Fig. 1 The proportions of oats, barley and wheat in selected years of the annual agricultural census for Scotland [1, 2]. In 1990 and 2018 w and s refer to winter and spring barley.

It is sometimes assumed that the period of agricultural intensification following WWII, and operating mainly between 1960 and 1990, caused the greatest upheavals in the history of agriculture, but major change in crops and output occurred during the Improvements after 1700 and then in the later 1800s.

Winter wheat, ripening in late August (@curvedflatlands)
Change at the turn of the century – 1900

Figures taken from the official agricultural statistics from 1883 [1] show a steady decrease in the area grown with arable crops compensated by an increase in the area of ‘permanent’ pasture. The total land area grown with all crops and grass was more stable.

In just less than two decades before 1900, around 10% of the cereal area was lost to grass. Turnips and swedes – the winter lifeline for people and stock since the 1700s Improvements – had begun a steady descent that was to continue well into the next century, and the grain legumes – peas and beans – had even then become minor crops.

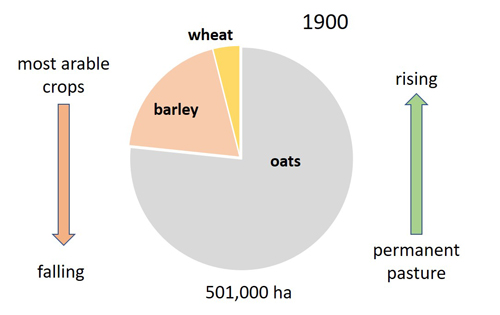
Fig. 2 Proportions of the three cereals in 1900 at a time when the area of grass was rising and arable (tilled) crops was falling. The area grown with cereals is shown under the pie diagram [1].

Symon labelled the period 1875-1914 ‘Forty bleak years’ [3],the bleakness caused as least as much by international trade pressures and inequalities in local society than anything biophysical. Yet he pointed to Scottish farming being ‘elastic’, enable to withstand the shocks of depression due to the three grains and the varied stockraising.

In and around 1900, oat occupied about three-quarters of the cereal area, barley around 10% and wheat the rest. The proportions of the three cereals changed little until after WWII. Economically, oats was less profitable than the other two but was hardier and easier to grow on the little nutrient resource available.

Spring barley, sown early, photographed 24 April, Angus coast (@curvedflatlands)
Intensification 1960 to 1990

The hard lessons of agricultural insufficiency in 1914, repeated in the 1940s, led to government-backed programmes for agricultural improvement, which also took advantage of new opportunities for international trade and technological advances [4]. Deeper cultivation allowed roots to explore an increasing volume of soil. Mineral nitrogen fertiliser became widely available and relatively inexpensive; and from the late 1970s chemical pesticides proliferated to control the many weeds and diseases that sought their share of the nitrogen! New cultivars were introduced with higher yield potential, mostly through a larger the grain ‘sink’, allowing a rising harvest index (grain/total mass).

Fig. 3 Proportions of area (pie diagrams) and total area (figures beneath) sown with oats, barley and wheat in 1945 and 1990. Barley in 1990 is separated into winter and spring varieties [1, 2].

The results of intensification were stunning. Cereal yields increased sharply from the 1960s. Most of the wheat was autumn sown, as was a proportion of the barley. Together these ‘winter’ crops came to occupy about 20% of the total cereal area. Compared to spring barley and oats, they were in full leaf at the time of peak solar income in late May, June and July. This shift in timing enabled them to accrue more photosynthetic mass to feed their higher grain ‘sink’.

Barley and wheat became more profitable as sources of alcohol and stockfeed. Oats – the only one of the three now used to feed people – declined to an area equivalent to that of wheat a century earlier. Most other cereal carbohydrate eaten by people is imported as bread, pasta, rice and maize.

Winter barley ready for harvest, late July, Borders (@curvedflatlands)

A quarter century of level output

During intensification, the area grown with cereals recommenced its pre-war decline (Fig. 3). By 1990, the cereal area was 90% of that in 1945.

But another and more significant change occurred. By the early 1990s, the rapid rise in yield due to intensification came to an end in the main cereal areas (for reasons that are not entirely clear). Yield increased a little over the next decade but then more or less levelled. Despite many technological advances, the rise in yield that began in the 1960s had been halted [3].

A similar pattern of levelling outputs has occurred in many parts of Europe and much farther afield. Is all now stagnation and decline?

Not quite. Recent records of yield and sown area suggest that while yield may be sensitive to bad weather years, such as the wet 2012 and dry 2018, farming has a capacity to shift land between the three cereals to offset the worst the weather can throw at it. Moreover, the yield per unit area of oats has increased to become close to that of spring barley [5].

Despite cereals giving poor economic returns at this time, the system is not mired and should be still able to respond to the inevitable impending change.

Whole-crop oats, being cut 30 July, Orkney (@curvedflatlands)
External and internal pressures / capacity for adaptation

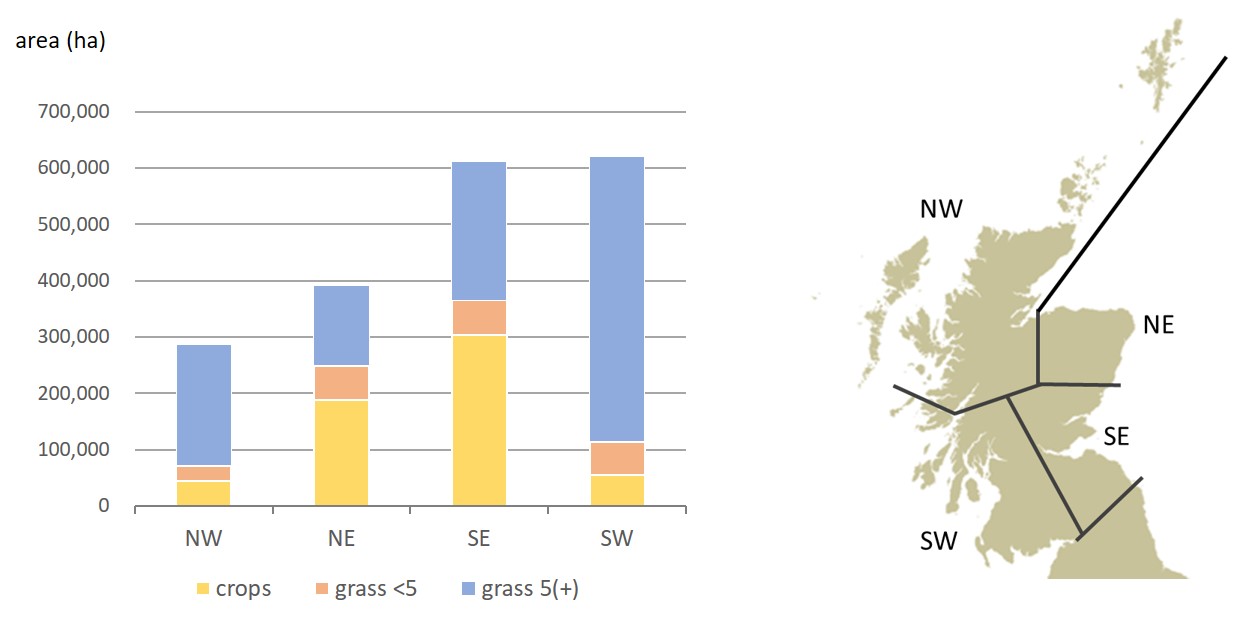
The cereal- and grass-based croplands of lowland Scotland face a set of internal and external pressures to which they must adapt. They include –

  • internal degradation of soil, element cycles and food webs due to intense cultivation, a factor likely to increase pressure on surrounding ecosystems but also to decrease the capacity of land to yield;
  • climatic change and extreme events of the type that dented output in 2012/3 and 2018;
  • continued reliance on external sources of nitrogen and phosphate fertiliser;
  • further pressure on the economic  position for mass-market grain, for example, owing to competition from other countries, trade wars and blockades.

One threat that should be no longer feared, however, is that of repeated crop failure, starvation and famine that hit parts of the country as recently as the mid-1800s. And there are increasing positives –

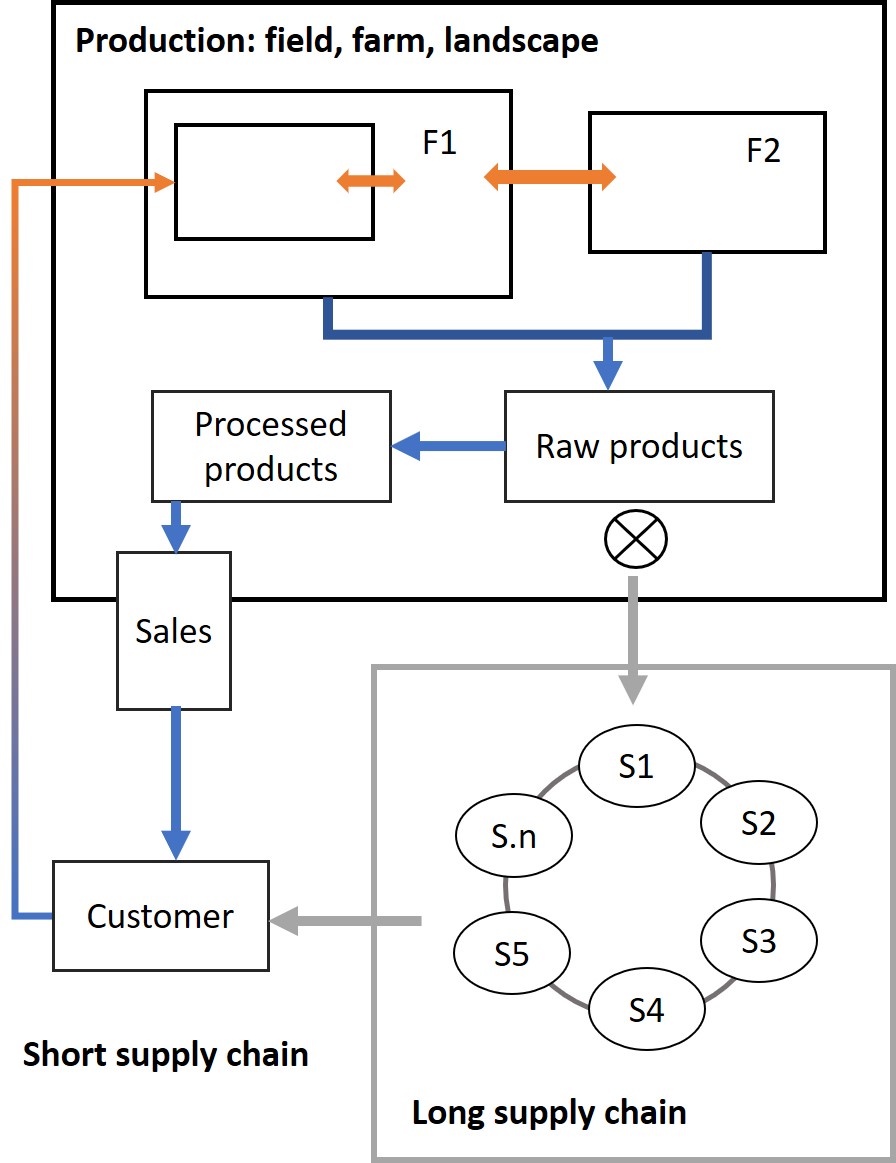
  • Greater demand for home-grown cereal products, for example through an increased desire for local, sustainable food and drink.
  • Technical innovations in cereal varieties and agronomy that open new higher-value markets.
Winter wheat ripening before harvest, late August, Borders (@curvedflatlands)
Retaining flexibility

The line of census records since the early 1880s has shown massive shifts in the total and relative areas cultivated with the species and in the agronomic inputs to those areas. If farming has adapted in a certain way, then it should be able to repeat or reverse the change. There are many options.

  1. Broad scale shifts in the proportions of crops and grass, possibly reversing in part the shift towards grass (Fig. 3).
  2. Continued decrease in the area grown with cereals but concentrating on higher-value products or higher yield, i.e. by taking cereals off the less productive land, a trend already apparent.
  3. Altering the proportions of winter and spring varieties to manipulate the trade offs between yield, inputs and biodiversity.
  4. Replacement of high-input winter cereals with less demanding spring oats in response to challenging conditions- as happened in the 2012-2013 wet years.
  5. Reintroducing wheat varieties for milling, for bread, biscuits and cakes, to reduce dependence on imports, and consequently shifting the aims to nutritional quality and away from bulk.
  6. Growing more ‘mixed grain’ – two or more cereals in the one field – or cereal-legume mixtures such as mashlum that need fewer agronomic inputs [6].
  7. Introducing grain legumes or grass-legume leys into cereal systems to reduce reliance on mineral nitrogen, improve soil and cut GHG emissions.

Now these might not seem like anything markedly out of the ordinary (when surveying the past 150 years) and indeed they are not. Yet cereal farming in many parts of the world would envy these possibilities: there are vast areas in some continents grown with only one main cereal that offers little scope to engineer change.

Moreover, the climate here, on the Atlantic seaboard, will probably not extend to real extremes due to its oceanicity. Complete crop failure caused by weather is still very unlikely here compared to places (for example) like New South Wales and Victoria in Australia where much of the cereal farming is already at risk without irrigation in a ‘normal’ year, and parts of Africa, where land is abandoned, too dry for growing maize.

Cereals fields in stubble, January, Strathspey (@curvedflatlands)

Sources, references

[1] Agricultural Statistics 1912. Volume 1, Part 1. Acreage and livestock returns of Scotland, with a summary for the United Kingdom. Board of Agriculture for Scotland. Some data included for the census years back to 1883. And subsequent yearbooks in this series up to 1978.

[2] Economic Report on Scottish Agriculture: 1980 onwards. Scottish Government – links to all data at Agriculture and Fisheries -Publications.

[3] Symon JA. 1959. Scottish farming: past and present. Edinburgh, London: Oliver and Boyd.

[4] Squire GR. 2017. Defining sustainable limits before and after intensification in a maritime agricultural ecosystem. Ecosystem Health and Sustainability 3/8 (open access, available at https://doi.org/10.1080/20964129.2017.1368873

[5] Cereal and oilseed rape harvest: 2018 final estimates. Scottish Government. Published 12 December 2018. Downloads available from link.

[6] For references to cereal-legume mixtures: Living Field posts Mashlum  – a traditional mix of oats and beans and Mashlum no more! Not yet.

Author/contact: geoff.squire@outlook.com

Funding  The author currently has honorary (unfunded) status at the James Hutton Institute, where he worked for 25 years. A background knowledge of crops, weather and climate was gained previously through funding from the UK Overseas Development Administration and UK Department of the Environment while based at Nottingham University (1970s, 1980s) and more recently through the Scottish Government Strategic Research Programme.

[Page last updated 5 April 2022]

Landscape mosaic defines pesticide loading

The latest Pesticide Use Survey for grass in Scotland presented by SASA [1] continues a line of meticulous reporting and analysis by the UK’s pesticide survey teams [2]. It allows the conclusions –

  • the 2017 survey, published 2018 [1], found 3% of permanent and temporary grass was treated with pesticide, most of which was chemical weedkiller (herbicide);
  • Scotland’s lowland farming areas comprise a mix of fields, some having  no pesticide treatment (temporary and permanent grass) and others having very high pesticide treatment (arable);
  • at the scale of the landscape, both the benefits and risks of pesticides depend on the proportions and spatial configurations of crops and grass;
  • data from the EU’s Integrated Administration and Control System (IACS) for farm payments are now being used by the Agroecolgy group at the James Hutton Institute, Dundee, to estimate pesticide pressure in landscape mosaics.

This note summarises the latests SASA data, gives examples of landscape mosaics in east Scotland and argues that ‘low pesticide’ does not always imply ‘high biodiversity’.

Sheep feeding on hay, winter on the lower Sidlaw hills

Three broad categories of grass are considered in census records – permanent or long-term grass, temporary or rotational grass and rough grazing [3]. Permanent and temporary grass are both managed to support commercial grazing and offtake of hay or silage for feed [4]. Only 3% of these categories of grass was treated with pesticide in 2017 [1]. Rough grazing covers much of the higher land, is largely unfertilised and less than 0.5% of its total area was treated with pesticide [5].

Most of the pesticide applied to the 3% of permanent and temporary grass is chemical weedkiller (or herbicide). Those fields treated typically receive one herbicide formulation in a year. The three most widely used herbicides were MCPA, Fluroxypyr and Fluroxypyr/triclopyr, mainly for control of broadleaf weeds such as docks and thistles [1, 6]. Other herbicides such as glyphosate were applied over a much smaller area. The largest area treated with any formulation was the estimated 11,400 ha receiving MCPA. In total, 25 different herbicide formulations were recorded as being applied to grass in 2017, but all except the three cited above were applied to very small areas [1, Table 5 in report].

View of mixed arable-grass landscape in the north-east region

No treatment of fungal disease? In arable crops, fungicides tend to dominate pesticide usage. Yet very little of the area of grass was treated for fungal pathogens. Fungicide treatments to grass have even decreased compared to the survey in 2009 [1]. The very small area treated with herbicide and the almost negligible use of fungicide imply that most managed grass here gets no pesticide.

Questions now arise as to whether spatial groupings of grass fields create low- or zero-pesticide landscapes and whether the presence of grass among arable fields moderates the much higher pesticide applications to cereals, vegetables and potato. To resolve these questions, it is necessary to know the spatial variation in grass and arable land across the country and locally.

Distribution of permanent grass, temporary grass and arable

The categories of permanent and temporary grass co-occur with arable or ploughed land mainly in the east, but also across the central belt and to the west. Permanent grass is left without being ploughed for many years. Temporary or ‘rotational’ grass is sown, cultivated for a few years and then ploughed and sown with arable crops for a few years. The cycle is usually repeated.

The total area of crops and grass was 1,910,347 ha in the 2017 census [3], of which 31% was arable and 69% grass, but the mix of crops and grass is far from uniform from west to east (Fig. 1, bar chart).

Fig. 1 Areas occupied by crops, grass under 5 years old (grass <5) and grass 5 years old and over(grass 5(+)) in the four regions shown right with simplified boundaries. Source: Economic Report for Scottish Agriculture 2016 and data for 2017 [3].

The north-west (NW) region has, despite its large area, the least of these three categories of land. The south-west (SW) and south-east (SE) have similar total areas of crops and grass, but the south-west (SW) has very much more permanent grass (grass 5 years and over) than the SE. The NE has similar proportions of grass and arable to the SE. The regions are indicated very approximately on the map in Fig. 1 – the actual boundaries between regions follow administrative units and can be viewed online in the Economic Report for Scottish Agriculture [3].

The varying balance of grass and arable in Fig. 1 is caused mainly by climatic differences between the wetter west (more grass) and the drier east (more arable). Most pesticides are used in the east because the climate there is dry enough for commercial growing of cereals, tubers and oilseeds.

Arable-grass landscape mosaics

Starting around the year 2000, it has been possible to map the configurations of crops and grass in the landscape using data from the EU’s Integrated Administration and Control System or IACS. A previous article on this site explains the method [8].

Results to date show that patches of land in the SE and NE regions  are rarely all-arable or all-grass, but the proportions of arable and grass can differ widely between localities. Two representative landscapes are compared below (Fig. 2) as circles extracted from the much larger surrounding land mass. Each small shape within a circle is an agricultural field or a stretch of woodland. The average size of fields across the country as a whole is 7 ha, but fields under mainly arable cultivation tend to be larger than fields under grass.


Fig. 2 Contrasting eastern landscapes (showing differing proportions of grass (light green) and cereals (red, orange). Other colours: dark green, woodland; yellow and blue, arable but not cereal. The average field size in the country is about 7 ha.

The next step is to assign a pesticide application to each of the fields. Pesticide surveys are based on a sample of farms, then upscaled using the proportions of crops and grass in different zones around the country [1]. It is not possible therefore to assign either a total pesticide usage or an application of specific formulations to individual fields.

For the purpose of risk-benefit analysis, the likely or potential pesticide usage  in fields can be assigned from a national or regional average based on fields sampled in the survey. These averages, which we usually call ‘nominal’ values offer a reliable first estimate of the degree to which landscape mosaics differ in pesticide applications. As described in Mapping pesticide loading spring cereals are typically treated with around 5 formulations, winter cereals around 10 and potato more than 20.

The landscape to the left in Fig. 2 is mostly grass (light shades of green) but with a few clusters of cereal fields (red, orange). Most fields will therefore not be treated but the red and orange fields will be treated with herbicides, fungicides and some insecticides.

The one on the right is mostly arable, again the cereals shown in red and orange. However, even in the densest arable areas, there is some grass that will not be treated with pesticide.  There are also clusters of all-arable fields, each of which will get treated with between typically 5  and 20+  pesticide formulations annually depending on the crop. The formulations applied will differ between the crop-types.  Therefore the red-orange-yellow clusters will be treated each year with a very wide range of active substances.  (Details can be found in the Arable Crops surveys by SASA at the link given in [1].)

View of mixed arable-grass landscape in the south-east region

Management at the landscape scale – no easy solutions

As described in a related article Mapping pesticide loading, the IACS data can be used to define potential hot-spots of pesticide application in relation to defined ecological risks or the presence of non-target organisms such as wild plants and insects. Configurations of the type shown in Fig. 2 are also needed to develop advice on management of the landscape, for example in preparing ‘area-wide integrated pest management (IPM)’ or restoring biodiversity and its many positive functions. (More on this in a later article.)

However, simply manipulating pesticide treatment by altering the proportions of crops and grass at the scales in Fig. 2 will not by itself lead to enhanced or more stable farmland biodiversity. The main reason is that grass fields have come to support a different and generally lower plant biodiversity than the most diverse cropped fields. Disturbed cropland subject to ‘rotation’ or sequences of different crops has the capacity to hold a buried soil seedbank of up to 40 or 50 mainly uncompetitive broadleaf plant species, which if allowed to germinate and grow support much of the invertebrate food web in agriculture. In contrast, permanent grass has a different composition, both of its visible plant species and its seedbank.

A major obstacle to progress is that little is known of the species-composition of managed grass in the lowlands. It has not been a priority for research funding in recent decades. One thing is certain, however – most grassland today is very much less diverse than it was in the 1800s and early 1900s. Notably, legumes such as clovers and vetches have almost disappeared from managed grass, as have broadleaf (dicot) species. This unheralded decline is yet another major, long-term shift in the biodiversity of agricultural land and will be explored in the next article in this series.

Acknowledgement and credits

Contact: Geoff Squire geoff.squire@outlook.com / geoff.squire@hutton.ac.uk.

IACS analysis and geospatial mapping – Nora Quesada nora.quesada.pizarro@hutton.ac.uk and Graham Begg graham.begg@hutton.ac.uk.

Scottish Government provided funding to the James Hutton Institute to carry out the analysis of IACS data used in Fig. 2.

Sources, references, links

[1] Pesticide Usage in Scotland. Grassland and Fodder Crops 2017. By Monie C, Reay G, Wardlaw J, Hughes J. Science and Advice for Scottish Agriculture 0SASA) Edinburgh, at http://www.sasa.gov.uk/pesticides/pesticide-usage/pesticide-usage-survey-reports. Usage reports are compiled for chemical pesticides applied to crops and grass, not to livestock. See [9] for guidelines on sheep dip and other sources of pollution from animal husbandry.

[2] For Pesticide use surveys across the UK as a whole see Fera Science Limited: https://secure.fera.defra.gov.uk/pusstats/surveys/index.cfm.

[3] The latest agricultural census (2017) is summarised in the form of spreadsheets and graphs at Economic Report for Scottish Agriculture at https://www2.gov.scot/Topics/Statistics/Browse/Agriculture-Fisheries/PubEconomicReport. The full regional map is given online in the 2016 Report at https://www.gov.scot/publications/economic-report-scottish-agriculture-2016/ then navigate to ‘Geography and structure’.

[4] The designations permanent and temporary grass have changed at various times since the late 1800s. In the current statistics released by Scottish Government [3], the grass designations are ‘grass five years old and over’ and ‘grass under 5 years old’. Additional categories of ‘direct sown’ and ‘undersown’ grass, each occupying small areas, are recorded in the SASA pesticide survey.

[5] Land classed as Rough grazing in Scotland occupied 3,718,795 ha in the 2017 agricultural census which is 66% of the Utilisable Agricultural Area [see 6]. Of this total less than 0.5%, or about 14,000 ha, was treated with pesticide (sources in [1] above) including Asulam [6] used mainly to control bracken (granted as an emergency measure).

[6] For information on herbicides, e.g. MCPA http://sitem.herts.ac.uk/aeru/ppdb/en/Reports/427.htm and Asulam http://sitem.herts.ac.uk/aeru/ppdb/en/Reports/1551.htm.

[7] Most of the fungicide applied to grassland in the 2017 survey was on ‘undersown’ grass, which is usually the name given to grass sown so as to emerge and grow underneath a nurse crop such as a cereal. About 48% of undersown grass was treated and even here it was ‘for the control and prevention of disease on the nurse crop [1, page 11]’.

[8] Integrated Administration and Control System, IACS: data became available from the EU’s IACS system from around 2000. The use of IACS data is described at Mapping pesticide loading.

[9] For information on sheep dip and other potential environmental hazards from livestock farming: see the SEPA (Scottish Environment Protection Agency) web pages at https://www.sepa.org.uk/regulations/land/agriculture/sector-specific-issues.

Regenerative agriculture : short supply chains

Comment on the meeting Farmers and Nature, SNH, 18 May 2018. Inspiring examples: holistic, diverse, innovative. Current support unfitting. Long supply chains need disrupting. Result-based payment a way forward. B for A and A for B.

Inspiring examples were heard today of a commitment to farming and wider land management by five different people and enterprises [1]. The aim of this SNH-sponsored meeting – Farmers and Nature: promoting success and looking forward, 18 May 2018 – was to get people to share their experiences of managing land for the long term and for a range of economic and environmental outputs. All five speakers agreed that just taking from the land was not feasible, but that ecological regeneration and maintenance were essential for a future. There was little prosaic description of what not to do. Rather, the day was a set of inspired personal accounts by people operating outside the expected norms of agricultural management and long food supply chains.

Fig. 1 Contrasting lowland landscapes, fields mapped in colour: greens representing various types of grass, orange cereals. Prepared by Nora Quesada and Graham Begg for the Living Field web site.

Diversity of landscape and land use (Fig. 1) means that no one set of prescriptions can be applied to gain environmental benefit in farmland. Flexibility is needed to allow local adaptation to solve local problems, as was heard.

Speakers were: David Aglen, Balbirnie Home Farms [2], specialising in combinable crops, veg and potatoes, grass for suckler cows and forestry; Bryce Cunningham, Mossgiel Farm [3] producing ‘non-homogenised milk, by Ayrshire cows grazing the historical pastures of Robert Burns’ and in doing so disrupting the established the long and convoluted supply chain for milk processing and marketing; Lynn Cassels, Lynbreck Croft [4] producing hens, pigs, cattle and bees and also planting trees, in what many would class as difficult land and climate; Roger Polson, Knock Farm, Hunty [5] running a mixed organic enterprise with suckler cows, breeding ewes, livery horses and spring crops; and Teyl de Bordes, Whitmuir Estate, near Selkirk [6], creating opportunities and support for a wide range of plants and animals in mixed farmland. Links to their work and presentations on the day via YouTube can be found near the bottom of the page [2 to 6].

The speakers saw themselves as far from the mainstream. It was not just that they thought themselves on the fringes, but that their neighbours and peers thought they were. Yet to me their philosophy and practices are examples of what will be central to a sustainable future. They are innovators, not complying with what is expected of farmers and crofters in the early 21st century. It was encouraging also to see some disruption of the long supply chains that force farm profits down and the decouple land from the consumer. 

Fig. 2 Some of the topics at the meeting, from general characteristics of a managed ecosystem, through products, methods and biodiversity, to criteria for support, payment and targeting. A for B is Agriculture for Biodiversity and B for A is Biodiversity for Agriculture (not presented in this form but highly relevant, see text below).

Common threads

Several general threads recurred among these examples, brought out both in the talks and in discussion (Fig. 2). One was the need to manage land holistically and over time and space rather than concentrate on one product that satisfies immediate economic demands. Most of the farms and crofts managed a range of saleable products and all farmed for the long term, despite having to overcome physical and sometimes economic hardships in the short term. ‘Work with nature not against it’ was the recurrent message: a hackneyed phrase some may think, yet true nevertheless. In the concepts discussed in these web pages, ‘working with nature’ implies managing multiple channels for the balanced flow of natural resources to soil, plants and animals [7].

Another was innovation – re-thinking how to do things. Farming did this in a big way during the Improvements era in the 1700s and in the Agricultural Expansion Programme in the late 1940s. In both instances, change was needed to overcome stagnation and reverse decline. Examples presented here included sowing tramlines to hinder surface wash after rain, and so  slowing the erosion of soil and loss of fertiliser as pollutant, and encouraging nitrogen-fixing legumes back into grass swards. 

Hardly innovations, you might think. But just look at the areas of compacted mush around most farm gates, and next time you see a mud-on-road sign, imagine where the mud came from; and then look at the imports of nitrogen and plant-protein to Europe due much to the cumulative loss over the last 150 years of home-grown legume pulses and forages. You can imagine also that some of the practices would have been seriously debated at  farmer-scientist meeting in the 1750s – running sheep on winter wheat when grass offered poor pasture was one, with little stated detrimental effect on the wheat (Balbirnie).

Support and conditions for agri-environment schemes formed a third thread (Fig. 2, lower box). Schemes were too inflexible, too prescriptive, for example in terms of dates that things should be done by,  and schemes rarely confirmed that a desired result had been achieved. Payment for result, specified in terms of populations and other ecological states was preferred and would ensure that public money led to a demonstrable, beneficial change.

And a fourth was the need to disrupt or bypass existing, mostly long, supply chains whose complexity determines, often obscurely and perhaps from thousands of miles away, what must happen on the farm, while the grower and manager has limited reward and control. The solution is to replace the long chain with a much shorter one from field and farm to consumer in one or two intermediate steps that involve retaining the production and marketing processes within the enterprise (Fig. 3). The experiences of Mossgiel Farm are a lesson. 

Fig. 3 Diagram of production and quality chains: production is buffered by operating across several different enterprises (F1, F2, etc.) that are interconnected in terms of the flow and sharing of resources over seasons and landscape; the short quality- or supply chain keeps processing and sometime sales within the enterprise (upper large box), adding value to the product and control to the grower, after bypassing an existing long chain. Design of supply chains is a main part of the EU project TRUE [9].

Result-based payment for agri-environment works

Teyl de Bordes introduced some examples of Result-based schemes in Europe in which farming is paid for delivering specified environmental benefits. Kirsten Brewster, from SNH, who organised the meeting and Teyl de Bordes since wrote a summary of six Results-based pilots. Here is an extract from their introduction. 

Result Based Agri-environment Payment Scheme (RBAPS) pilots “Results-based” is a term used to refer to agri-environment type schemes where farmers and land managers are paid for delivering an environmental result or outcome, e.g. number of breeding birds, or number of plant species in grasslands, with the flexibility to choose the management required to achieve the desired result. 

All agri-environment schemes are of course designed to deliver environmental results. However, what distinguishes a ‘pure’ results-based scheme, is that payments are only made where a result is achieved, making a direct link between the payment and the achievement of defined biodiversity outcomes (or other environmental results) on the ground. Focusing payments on achieving results encourages farmers to use their knowledge and experience to decide how to manage the land in a way that benefits biodiversity alongside farming operations. In so doing, results-based payment schemes may lead to an enhanced awareness of the importance of biodiversity conservation and protecting environmental resources as part of the agriculture system. http://ec.europa.eu/environment/nature/rbaps/articles/1_en.htm

The report by Brewster and de Bordes gives descriptions and links for each of 6 pilot studies and is downloadable as a PDF [8].

A for B and B for A

A distinction not discussed specifically at the meeting but one that is highly relevant to the design of future support, joins Agriculture (A) and Biodiversity (B) in two directions [10]. A for B is where agriculture, either inherently or by alignment, fits its methods and management to support certain life forms such as rare plants, invertebrates or birds. B for A is where essential life forms have to be maintained in a good functioning state for agriculture to continue sustainably. Examples of B for A include microbial transformations in the soil and the broadleaf weed (= wild plant) flora supporting predatory organisms that suppress pests.

Most existing schemes and support operate A for B, but in doing so almost exclusively, they do little to encourage the sustainability of agriculture.  A topical example is the argument around legumes such as peas in CAP Greening. Peas bolster a wide range of ecological processes – N-fixation, allowing a diverse dicot weed flora and enriching the habitat mosaic – yet the main and possibly only purpose of pea crops in greening measures is to be in the ground at a certain date in summer.

Whatever weighting is given to A for B and B for A, most of the ecological processes operate at scales well beyond the field. Such is the diversity of land use in the lowlands (e.g. Fig. 1) that landscapes of only a few km diameter may need specific measures. Flexibility therefore and payment for results, not blanket prescriptions, should be the basis of future support.

References, links

[1] Farmers and nature: promoting success and looking forward. Click the following links for Agenda and Speakers and the Presentations.

[2] David Aglen, Balbirnie Home Farm. Web: http://www.balbirnie.com/people. YouTube video of presentation:  Regenerative agriculture at Balbirnie. 

[3] Bryce Cunningham, Mossgield Farm. Web: mossgielfarm.co.uk Presentation on Youtube: The challenges of breaking the mould. 

[4] Lynne Cassels, Lynbreck Croft, south of Grantown-on-Spey. Web: https://www.lynbreckcroft.co.uk. Presentation on YouTube: A croft for the future

[5] Roger Polson, Knock Farm Presentation on YoTube: Managing Knock, a holistic approach. 

[6] Teyle de Bordes, Whitmuir Estate: Twitter: https://twitter.com/whitmuir1?lang=en. Presentation on YouTube: Recording nature on the farm. 

[7] Crops, grass and management open or restrict channels through which energy and nutrients flow to sustain a managed ecosystem’s various parts. See Crop Diversification at the Living Field, also [9]. Diversity of practice is the key – maintaining  to the soil and the wider food web of both invisible and visible biodiversity. Narrow the diversity and a single product might prevail, but the system fragments.

[8] Result Based Agri-environment Payment Scheme (RBAPS) pilots: K Brewster and T de Bordes, 31 May 2018. Click to download PDF BrewsterdeBordes-resultsbasedagrienvtrials.

[9] The EU H2020 TRUE project is actively developing short supply chains for legume-related crops and products. the project has much in common with many of the the sentiments of this meeting. More on TRUE on these web pages at Transitions to a legume-based food and agriculture where there are also links to the TRUE web site.

[10] The concept A for B and B for A (A = Agriculture, B – Biodiversity) which draws a workable distinction that could be introduced to future support, has been widely promoted by the agroecologist Paolo Barberi from the University of Pisa.

Acknowledgements

Scottish Natural Heritage organised the meeting. Contact: Kirsten Brewster, Kirsten.Brewster@snh.gov.uk. Kirsten Brewster and Teyl de Bordes provided access to their article on Result-based schemes, with thanks.

This article is an offshoot of work on crop diversification and food quality chains in the EU H2020 TRUE project based at the James Hutton Institute, Dundee. Views are those of the author, Geoff Squire: geoff.squire@hutton.ac.uk.

web thoughts

From December 2016,  the curvedflatlands web site will offer facts, opinion and discussion on the topics of food security, sustainable agriculture and the environment.

Content will draw mainly on the activities and outputs of the Agroecology group in Dundee and its wide range of collaborations and contacts around the world.

‘Posts’ on this page will generally introduce a topic for discussion, which will then be extended, perhaps after some weeks, in the main Content pages, viewable from the top menu and from the right hand sidebar.

cf_vtr_sprmn_jd_750The site will promote the personal views and achievements of those who worked on these complex systems since the late 1990s, now at the James Hutton Institute, previously the Scottish Crop Research Institute. Further information can be found under ‘This site’ in the content pages.

Other parts of the site will highlight scientific results, the people involved and the major case study area of the Atlantic croplands.

The image is an etching by Jean Duncan title ‘supermoon’. For more on Jeans’s work, see her pages on the Living Field web site.