The 2018 summer drought

The 2018 summer of low rainfall was one of the driest on record. Cereal grain harvest dipped but did not fail, loss of production caused more by conditions in the previous winter than the summer drought. A further example of grain harvest’s resilience to untypical weather in the north-east Atlantic. 

This extended version of an article originally published on the Living Field web site [1] looks in more detail at the rainfall patterns of early summer last year in lowland Scotland.

The long summer of unusually low rainfall in 2018 parched much of the grassland and stunted many of the cereal crops in eastern and central regions. The wheat and barley appeared to suffer in many places. A record low for grain output looked set to happen. Yet the yield figures suggest a remarkable resilience to what turned out to be unusual weather for the region.

First the rainfall …. How low was it?

Daily rainfall records for East Scotland

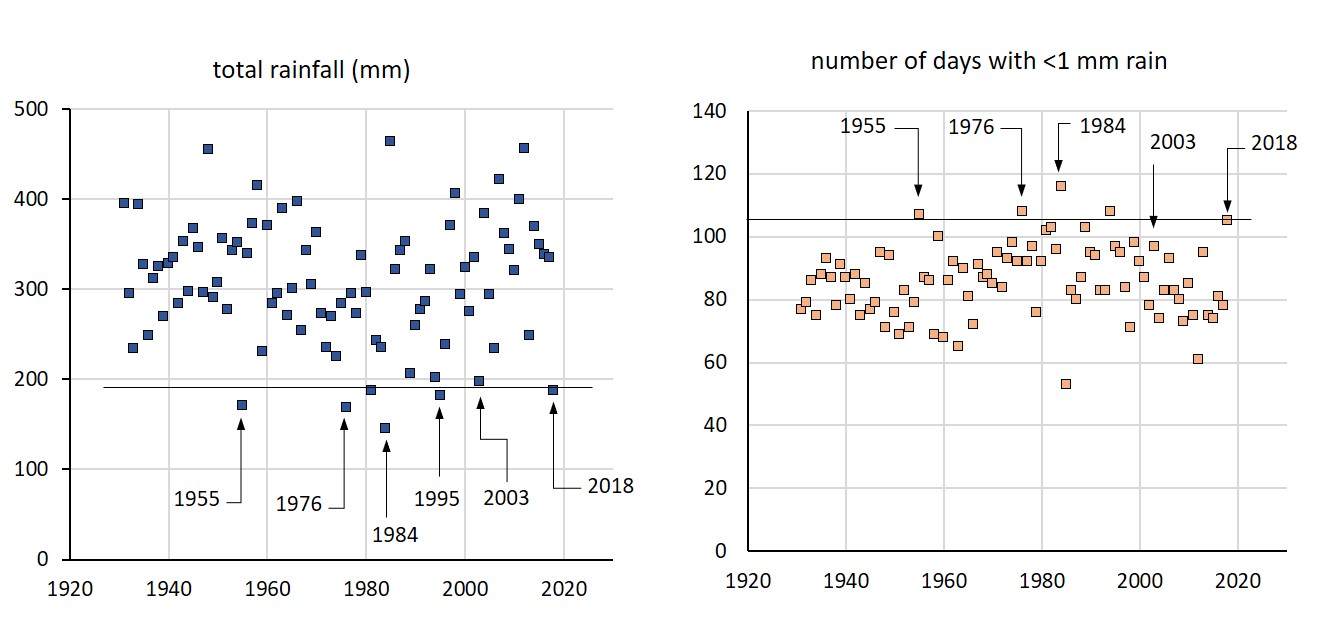
The Met Office provides several valuable series of historical weather data. The analysis here uses the daily rainfall series for regions of the UK from 1931. The method of deriving such regional records by combining site by site observations was described by Alexander & Jones in 2001 [2]. The rainfall series has been continually updated since then. The Met region ‘East Scotland’ is the one where most of the wheat, barley and oats are grown.  The period in 2018 from April to the end of August joins that of several other years in being unusually dry – 1955, 1976, 1981, 1984, 1995, and 2003 all had rainfall below 200 mm (Fig. 1a).

Fig. 1 Rainfall between 1 April and 31 August for the East Scotland region in all years since 1931, showing (a) total over the period, left; and (b) days with less than 1 mm, right. The line is the value in 2018. Years of low summer rainfall are arrowed. Data source: Alexander & Jones, 2001 [2].

There is little sign of any major trend in either low or high rainfall over the main summer period. Many of the other years after 2000 were much wetter than 2003 and 2018. The highest rainfall of recent times was the very wet 2012, which had more rainfall than all other years except two. What distinguishes 2018 is the pattern of rainfall.

Fig. 2 Cumulative rainfall from 1 April for selected years showing the rapid rise during May in 1976 and 2003, a slow rise after April in 2018 until mid-July and the driest year 1984. Data source: Alexander & Jones, 2001 [2].

Many of the years having low summer rainfall had a fairly wet May, as evident in the steep rise in cumulative rainfall in 1976 and 2003 in Fig. 2. The same pattern occurred in the dry 1955 (not shown). This rainfall in May fills the soil enough to allow the crops to last through a dry June and July at which point most of the season’s growth has occurred.

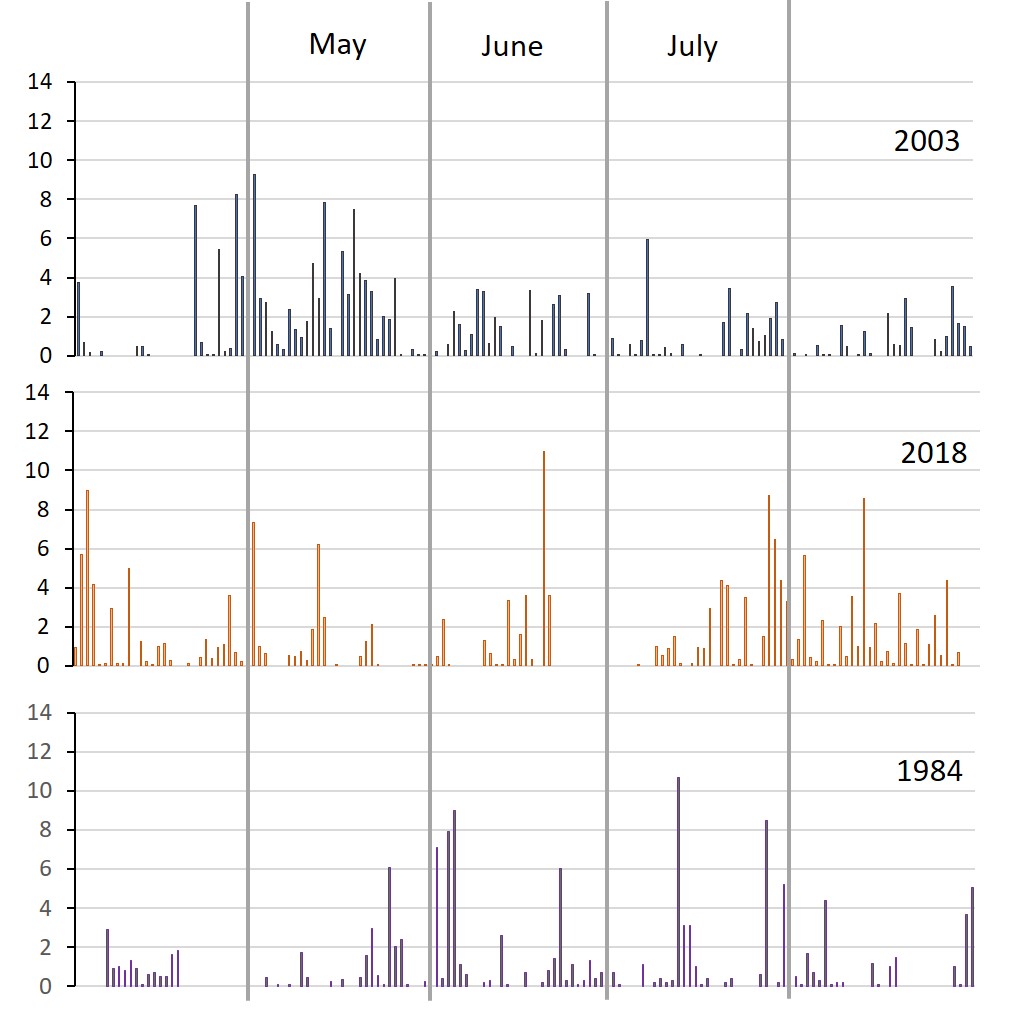
2018 had a wetter April then most other dry years but then low rainfall until late July. Although 1984 had the lowest rainfall overall, 2018 had the lowest from late April through to mid-July, which is when the solar income is large and when the crops are bulking. Summer rainfall in 2018 would have been less in total than in 2003 if it had not been for that rain in late July and early August. A day by day view of the rainfall in 2018 compared to 1984 and 2003 is given in Fig. 3.

Fig. 3. Daily rainfall from 1 April in three contrasting years: 2003 and 2018 had a similar total rainfall whle 1984 was the driest over this period.

So did this low rainfall during crop bulking have an effect?

Yield figures for 2018

Each year the Scottish Government provide absolute records of crop-areas (i.e. all fields counted) and estimates of yield per unit area based on data from a range of sources. The final estimates are published in December [3].

The wet year of 2012 provides a comparator: most crops but particularly wheat, oats and oilseed rape produced a low yield per unit area that year because of waterlogged soil and low solar income [3]. Total cereal output was lower that year than in any other year of the past two decades.

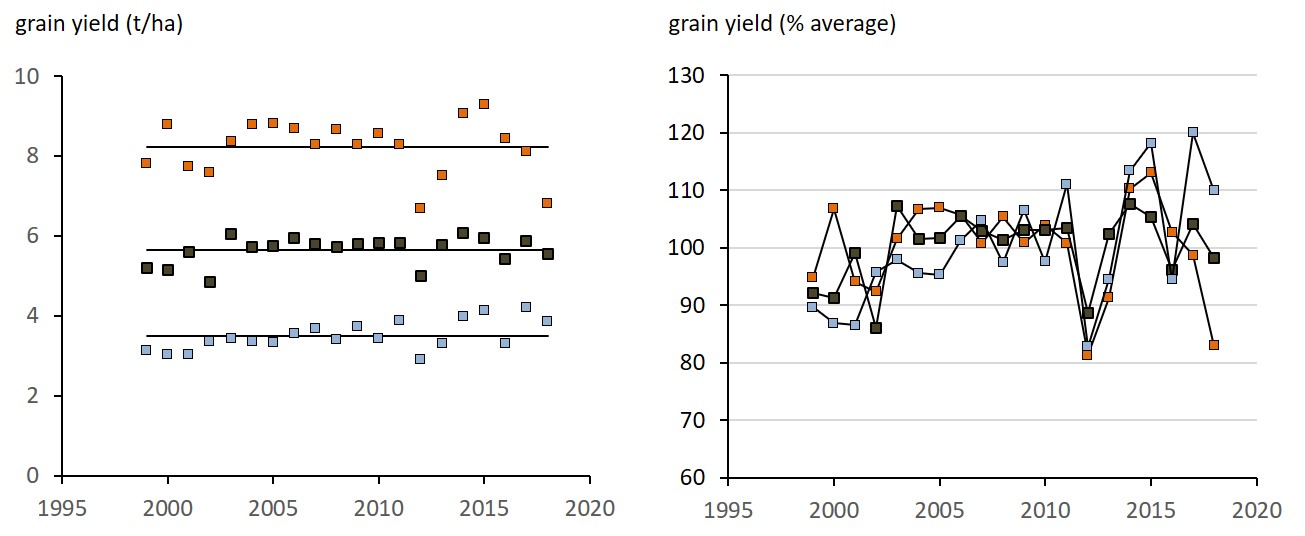
The records show 2018 yields were no worse. Wheat yield per unit area (t/ha) was down to near the 2012 value but most of the other crops showed little fall in yield (Fig. 3). When expressed as a percentage of the average of recent years, the simultaneous dip among crops in 2012 was not repeated in 2018 (Fig. 4). Spring barley, the most widely grown crop suffered a minor fall to 98% of the long term average.

Fig. 3 Grain yield of wheat (red), oats (black) and oilseed rape (blue) over the last 20 years shown as weight harvested (left) and percent of average (right).

Was anything different about 2018. Total cereal output (the sum of wheat, barley and oats) was low, in fact just above the 2012 value, but this was due to reduced land areas sown with cereals, mainly winter barley which was sown in the autumn of 2017 before the summer drought of 2018. Sources in [3] state ‘Winter barley area dropped by a fifth due to poor weather conditions. This, along with a four per cent drop in yield resulted in production decreasing by 24 per cent.’ The greater effect therefore occurred before the winter and ‘was a result of the difficult weather conditions in late 2017.’

It appears therefore that yields per unit area – the best guide to the effect of weather on the summer bulking conditions – were not strongly affected by the 2018 drought.

Caution is needed because the yield figures are an estimate, i.e. not measured for all crops. Some crops were not harvested for grain at all, where the weather ‘resulted in a number of farmers choosing to whole-crop due to the low yield and quality [2].’ (To ‘whole-crop’ means to take all the grain and straw together for feed without separating the grain.) Some of the poorest yielding fields might have been removed from the estimate of yield since whole-crop cereals would not have been included in grain yield inventories.

Could grain yields collapse in this region?

Drought leads to zero crop yield in many countries. Even in parts of Australia, where standards of agronomy and resource-use are high, recent droughts have led to total failure of cereal crops that are not irrigated.

So could crop failure occur here? In principle yes. But it would have to be a much drier year than any since the records began in 1931. Given there is no discernible trend towards low summer rainfall and that most years between 2003 and 2018 were wet, and two of those years – 2014 and 2016 – produced among  the highest mean yields ever in this region, there are certainly no indications that summer droughts will become a feature of the Atlantic maritime cropland.

Winter flooding may come to impose more severe limitations to agricultural production …. [4].

Sources, links

[1] The Living Field web site at Resilience to the 2018 drought.

[2] Daily rainfall series from 1931: Alexander, L.V. and Jones, P.D. (2001) Updated precipitation series for the U.K. and discussion of recent extremes, Atmospheric Science Letters doi:10.1006/asle.2001.0025. Further information at the Met Office’s Hadley Centre web site: https://www.metoffice.gov.uk/hadobs/hadukp/

[3] Cereal and oilseed rape harvest: 2018 final estimates:  https://www.gov.scot/publications/cereal-oilseed-rape-harvest-2018-final-estimates/ Published 12 December 2018. See also https://blogs.gov.scot/statistics/2018/10/04/2018-scottish-cereal-harvest/

[4] Links to Living Field articles on high rainfall: The late autumn floods of 2012, Winter flood,  Winter flood … continued and Effects on corn yields of the 2016 winter flood.

Author/contact: geoff.squire@hutton.ac.uk or geoff.squire@outlook.com

Funding  The author currently has honorary (unfunded) status at the James Hutton Institute. A background knowledge of crops and climate in Scotland was gained in past years through funding through the Scottish Government Strategic Research Programme.

Grass mix diversity a century past

Innovative seed mixtures from the early 1900s based on functional properties of species. Legumes around 20% of seed mix by weight. Increasing complexity to suit purpose and longevity of the sward. De-diversification in the last 100 years. One of a series of articles on crop-grass diversification.

Diverse grass fields were once a common feature of the agricultural landscape. Mixtures of grass, legumes and other species were widely trialled and adopted in the Improvements era after 1700 [1]. Mixtures were promoted throughout the late 1800s and early 1900s, the topic of this article.

The aim of mixtures was to provide a balanced diet for livestock and to regenerate soil condition and fertility. Nitrogen-fixing legumes in mixtures had the specific roles of enriching soil with nitrogen, before mineral fertiliser came to be widely used from the mid-1900s, and offering livestock a high-protein bite compared to the grasses.

Most traditional meadows have now been converted to fertilised grass or crop. Much of the grass now grown for hay or pasture consists of one or two grass species, with occasionally white clover and often some noxious weeds. Legume forages are now uncommon. Managed grass is usually supported by mineral fertiliser and by imports of high-protein legume-based feed supplement.

Grassland. Shapinsay, 27 May 2019

Change may be afoot! Recent EU funding rounds have brought together researchers and specialists to design and trial new food and feed systems which aim to reverse some damaging trends both in the field and the wider food supply chain [2]. Part of the solution is a re-diversification of agriculture.

To explore some of the main current themes, the Living Field [3] and this web site are running a series of articles on diversification in land use and food production. Many of the forgotten practices of the past are still relevant. Here we look at the structure of diverse ‘grass’ mixtures recommended in the late 1800s and early 1900s.

Groups and species

Traditionally in Scotland, managed ‘grass’ (as distinct from rough grazing) was rarely just left as permanent, untended grazing land. It was either sown for hay or pasture over one, two or three years or left longer as ‘permanent’ grass, but even the latter was usually re-sown after a time to re-introduce species forced out by the more competitive grasses. Published in 1925, W M Findlay went into some detail on how grass mixtures were managed, but the specific interest is that he described mixtures in terms of the mass of seed of each component species [3].

Fig. 1 A seed mix made up of grass (blue-green) and legume (red): the inner circle showing all grass and all legumes; the outer circle showing two grass and two legume species.

The lists in Findlay are here presented as circular diagrams of the type illustrated in Fig. 1. The inner circle shows the percentage of seed from the grass family (blue – green) and the legume family (red). The outer circle shows the percentage seed of each species of grass or legume, individual species distinguished by different colours or shades.

In the example shown, the grass makes up about 80% and the legume 20%. There are two species of grass and two species of legume. This is a simple mixture but is still more diverse than many grass fields today.

Cattle on rolled hay field, Inverness-shire, 22 June 2019
Mixtures of increasing complexity

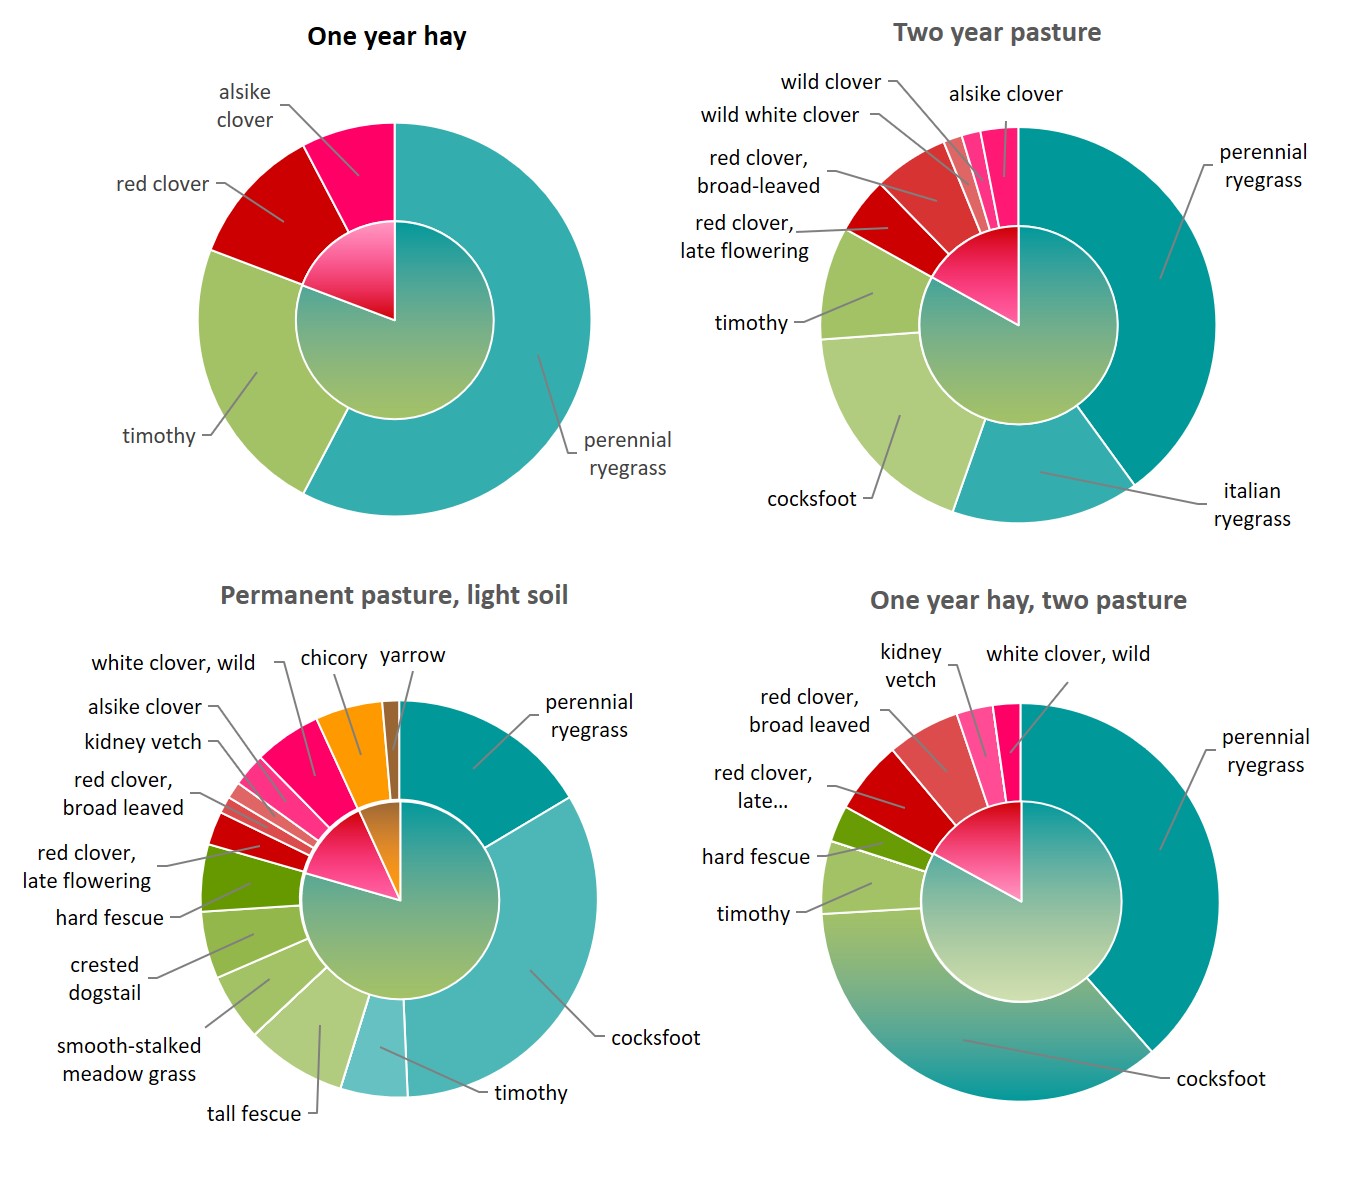
Four mixtures are shown in Fig. 2, the one top left is that from Fig. 1 but with species indicated. It is a mixture recommended for one year’s hay, after which it will be cultivated and turned to arable or transformed into another mix. The next three, moving clockwise, are mixtures of increasing complexity – top right is for two years’ grazing,  lower right for hay followed by grazing and the lower left for permanent grass.

The number of species increases in both grass and legume categories from top left clockwise. The permanent grass mix contains a third category – broadleaf or ‘dicot’ species that are not legumes (orange brown). Of the latter category, chicory and yarrow are included but not plantain which was commonly sown in ‘grass’ mixtures in the Improvements era.

Fig. 2 Four ‘grass’ seed mixes of increasing complexity from top left clockwise, intended for different purposes shown above each circle. Plant species and their proportions, based on sown seed mass, are indicated by different blue-green colours for grasses, red for legumes and orange-brown for broadleaf-but-not-legume plants. Original data in Findlay (1925)

In all categories, grass occupied about 80% (four fifths) of the mixture and legumes 20%, or a little less in permanent grass. The legumes include red clover (two forms), white clover (including a ‘wild’ version), alsike and kidney vetch. The permanent grass mix also has chicory and yarrow.

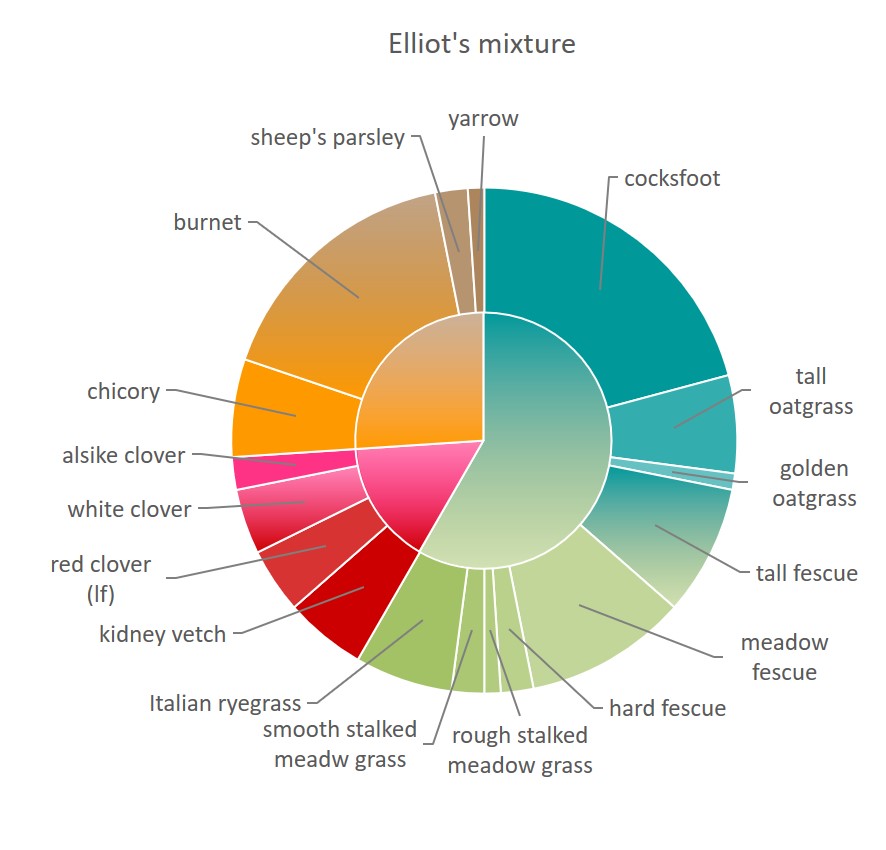
Findlay also gives an example (Fig. 3 here) of one of R H Elliot’s mixtures from his book Agricultural Changes (1898) which was later published as The Clifton Park System of Farming [5]. Notable in Elliot’s mix is the presence of legumes but also the much greater proportion of other broadleaf plants, most of which were included for specific functional properties [6]. Findlay does not agree wholeheartedly with Elliot’s recommendations, relating for example from his own trials that some of the broadleaf plants did not penetrate a hard soil pan, as Elliot suggested they would.

Fig. 3 Proportions of main groups and species in one of Elliot’s seed mixes [5] given in Findlay [4]: grasses, blue-green; legumes, red; other, orange yellow.

The proportion of seed in mixes was based on trials to assess how much seed of each was needed to cover an acre. Then seed mass was adjusted to suit the balance in the mixture, seed size and germinability and whether hay (flowering heads, less dense) or pasture (leaf, more dense) was the aim.

Were native plants used? Many of the grasses and legumes are native to Britain, but there was an international trade in seed then as now. Many varieties were imported for testing and usage. Over time, lays and pastures would have become a mix of native and imported populations.

The mixtures recommended by Findlay and those by Elliot are based on serious investigative studies that imply a sound knowledge of plants. They were devised at a time before mineral nitrogen fertiliser became cheaply available and among the primary aims of the mixtures was to increase the ‘health’ and fertility of soil as well as feed livestock.

Hay field recently cut & baled, Carse of Gowrie, 20 July 2019
The contribution of nitrogen fixing legumes

By the early 1800s, forage legumes had become standard in sown grass mixtures.  Writing well before Findlay and Elliot, H Stephens in The Book of the Farm [6], first published 1841,  gave weights of the grasses and legumes in mixtures designed for a range of purposes. (The author farmed in Angus for part of his life.) Stephens gives the seed weights for mixtures suited to various durations and conditions: he even includes all-legume mixes and his short-term lay contains about one-third legumes by seed weight.

In all these accounts, the main forage legumes were red clover Trifolium pratense in various forms and white clover T. repens. Others referred to by these authors, included in mixes for specified durations and soils, were alsike T. hybridum,  suckling clover T. minus and crimson clover T. incarnatum (the latter generally considered unsuitable for northern latitudes of Britain but will grow here) Other species were the medic or hop-trefoil Medicago lupulina, bird’s-foot trefoil Lotus corniculatus,  lucerne Medicago sativa and kidney vetch Anthyllis vulneraria.

These are by no means the only ones trialled in Scotland. There was clearly a thirst in the 1700s and 1800s to explore a wide range of species before settling on the clovers. In The Book of the Farm (1908 edition revised by MacDonald), they write about clovers:

” …. the most valuable herbage plants adapted to European agriculture – the white and red clovers. Notwithstanding what has been said of the superiority of lucerne, and of the excellence of sainfoin in forage and hay, the red clover for mowing and the white for pasturage, excel, and probably ever will, all other plants.”

Despite the uncertainty in how seed mass translated to plant mass, Findlay provides one of very few quantitative descriptions of the proportion of nitrogen-fixing legumes in a mix from the period shortly after WW1 when the scientific study and practice of agriculture was becoming established.

Clovers used in grass mixtures: (top left c’wise) red, white, crimson with white, crimson flower and alsike.
Mixtures were planned based on functional characteristics

The mixtures suggest there was a practical understanding of how species would interact when growing in a field. The author points to eight different properties that should be considered in choosing a mix.

  • Adapted to the local soil:  particularly to sandy or peaty soils.
  • Longevity: early or fast growth coupled to short life, e.g. red clover not expected to survive in permanent grass.
  • Habit of growth: a correct mix of ‘top’ plants that provide much of the fodder and ‘bottom’ plants that cover soil and ensure no gaps.
  • Time of year: a correct mix of developmental phases to ensure growing foliage is present for as long as possible.
  • Readily eaten by stock: (fairly obvious but) need to avoid plants that are less palatable or which become unpalatable with age.
  • Feeding quality: (again fairly obvious but) need by experience to assess quality depending on local conditions and manage so as not to diminish quality (and Findlay admits that quality was at that time difficult to measure).
  • Must die when ploughed: so as not to occur as weeds in subsequent crops (less important if permanent pasture is the aim).
What happened next?

One of the great uncertainties in defining agricultural trends is how the composition of grass mixtures changed since the annual census began over 100 years ago. Whereas, the areas sown with grains such as peas and beans were recorded [8], legumes in grass mixtures were not recorded. The census restricts managed grassland to the two main categories, short-term and ‘permanent’. For a time, the census also recorded the proportion of each used for hay or grazing.

There has been no consistent recording of the composition of grass, so the trajectory from the recommendations of the 1920s to the present is unknown. Yet travelling around the country, observing grass and crops, usually from the other side of the fence, leads to the conclusion that most current grass is far from diverse. In some fields there is one or two species, typically perennial ryegrass and timothy. Legumes except for the occasional white clover are absent. In the main, managed grass in Scotland has been de-diversified.

But not all of it …… [Further articles in this series will look at remaining sources of grassland diversity in low-input and organic farming and in commercial seed mixtures.]

 Sources, references, links

[1] Andrew Wight’s travels in the late 1700s describe first hand the improvements in field practice that commonly included sowing mixtures of grasses, legumes and other plants. Available online: Wight, A. 1778-1784. Present State of Husbandry in Scotland. Extracted from Reports made to the Commissioners of the Annexed Estates, and published by their authority. Edinburgh: William Creesh. Vols I-VI (e.g. search for title in Google Books).

[2] Recent EU research funding in agricultural and food systems is distinguished by the inclusion of a wide range of small enterprises that will be effective in rediversification. Agroecology at the James Hutton Institute (Dundee, UK) is leading several EU initiatives of this type including TRUE true-project.eu and Diversify plant-teams.eu.

[3] The Living Field project www.livingfield.co.uk at the James Hutton Institute promotes outreach and education. Its garden near Dundee displays many of the plants grown for food and feed, including most of those noted above.

[4] Findlay, W M. 1925. Grassland in Scotland. In ‘Farm Crops’ edited by W G R Paterson. The Gresham Publishing Company, London.

[5] Elliot RH. 1898. Agricultural Changes, later published as The Clifton Park System of Farming. Available online at journeytoforever.org.

[6] Stephens H. 1841. The Book of the Farm. Blackwood, Edinburgh. Printed in many subsequent editions in the later versions of which, revised and re-written, it was named Stephens’ Book of the Farm. Available online from various sources.

[7] Most plants in Fig. 2 and Fig. 3 are recognisable from the common names given by Findlay.  Burnet probably refers to fodder burnet, now given the botanical name Sanguisorba minor and recognised as subspecies muricata to distinguish it from salad burnet (subspecies minor).

[8] Trends in grain legumes and the benefits of increasing their presence in modern agriculture and food supply chains are examined by: Squire, Quesada, Begg & Iannetta. 2019. Transitions to a greater legumes inclusion in cropland ….. Food and Energy Security https://doi.org/10.1002/fes3.175 doi (available free online).

Author/contact: geoff.squire@outlook.com or geoff.squire@hutton.ac.uk.

Funding  The author currently has honorary (unfunded) status at the James Hutton Institute. A background knowledge of crop-grass mixtures was gained in past years through funding from the Scottish Government Strategic Research Programme and EU projects, mainly TRUE [2].