Summary
Cereal farming in the north Atlantic region improved to a point in the mid 1900s where starvation and famine were a distant memory. Half a century on from then, impending pressures through soil, climate and economics are threatening stable and reliable grain production. Yet the dire predictions of some commentators are unlikely to happen. Cereal farming has repeatedly adapted and survived since the first settlers brought grain to these islands.
This article summarises the changes that have occurred over the past century and suggests the system has in-built resilience through its combination of three grains – oat, barley and wheat.
Cropland in the northern part of the British Isles has grown barley, wheat and oat as its main cereal grains for thousands of years. Barley and wheat have been recorded since the neolithic, oats perhaps later. Cultivation of all three has sustained people and had been demonstrably sustainable, in that it continues. There is no reason in principle why it should not continue well into the future.
Until the mid-1900s, these three home-grown grains were the main food of people and livestock. Other crops such as rye have occupied little area. However, at no time were the areas or proportions or uses of these crops fixed. Rather, they have changed as part of long term societal trends and over shorter time scales in response to international markets and bad-weather years.
In 1900, oats dominated. Then the next 100 years saw major changes in the proportional area of the three cereals (Fig. 1).
Fig. 1 The proportions of oats, barley and wheat in selected years of the annual agricultural census for Scotland [1, 2]. In 1990 and 2018 w and s refer to winter and spring barley.
It is sometimes assumed that the period of agricultural intensification following WWII, and operating mainly between 1960 and 1990, caused the greatest upheavals in the history of agriculture, but major change in crops and output occurred during the Improvements after 1700 and then in the later 1800s.
Change at the turn of the century – 1900
Figures taken from the official agricultural statistics from 1883 [1] show a steady decrease in the area grown with arable crops compensated by an increase in the area of ‘permanent’ pasture. The total land area grown with all crops and grass was more stable.
In just less than two decades before 1900, around 10% of the cereal area was lost to grass. Turnips and swedes – the winter lifeline for people and stock since the 1700s Improvements – had begun a steady descent that was to continue well into the next century, and the grain legumes – peas and beans – had even then become minor crops.
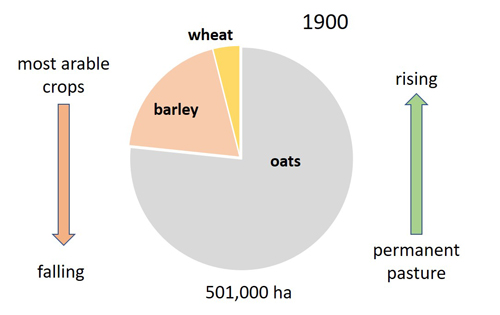
Fig. 2 Proportions of the three cereals in 1900 at a time when the area of grass was rising and arable (tilled) crops was falling. The area grown with cereals is shown under the pie diagram [1].
Symon labelled the period 1875-1914 ‘Forty bleak years’ [3],the bleakness caused as least as much by international trade pressures and inequalities in local society than anything biophysical. Yet he pointed to Scottish farming being ‘elastic’, enable to withstand the shocks of depression due to the three grains and the varied stockraising.
In and around 1900, oat occupied about three-quarters of the cereal area, barley around 10% and wheat the rest. The proportions of the three cereals changed little until after WWII. Economically, oats was less profitable than the other two but was hardier and easier to grow on the little nutrient resource available.
Intensification 1960 to 1990
The hard lessons of agricultural insufficiency in 1914, repeated in the 1940s, led to government-backed programmes for agricultural improvement, which also took advantage of new opportunities for international trade and technological advances [4]. Deeper cultivation allowed roots to explore an increasing volume of soil. Mineral nitrogen fertiliser became widely available and relatively inexpensive; and from the late 1970s chemical pesticides proliferated to control the many weeds and diseases that sought their share of the nitrogen! New cultivars were introduced with higher yield potential, mostly through a larger the grain ‘sink’, allowing a rising harvest index (grain/total mass).
Fig. 3 Proportions of area (pie diagrams) and total area (figures beneath) sown with oats, barley and wheat in 1945 and 1990. Barley in 1990 is separated into winter and spring varieties [1, 2].
The results of intensification were stunning. Cereal yields increased sharply from the 1960s. Most of the wheat was autumn sown, as was a proportion of the barley. Together these ‘winter’ crops came to occupy about 20% of the total cereal area. Compared to spring barley and oats, they were in full leaf at the time of peak solar income in late May, June and July. This shift in timing enabled them to accrue more photosynthetic mass to feed their higher grain ‘sink’.
Barley and wheat became more profitable as sources of alcohol and stockfeed. Oats – the only one of the three now used to feed people – declined to an area equivalent to that of wheat a century earlier. Most other cereal carbohydrate eaten by people is imported as bread, pasta, rice and maize.
A quarter century of level output
During intensification, the area grown with cereals recommenced its pre-war decline (Fig. 3). By 1990, the cereal area was 90% of that in 1945.
But another and more significant change occurred. By the early 1990s, the rapid rise in yield due to intensification came to an end in the main cereal areas (for reasons that are not entirely clear). Yield increased a little over the next decade but then more or less levelled. Despite many technological advances, the rise in yield that began in the 1960s had been halted [3].
A similar pattern of levelling outputs has occurred in many parts of Europe and much farther afield. Is all now stagnation and decline?
Not quite. Recent records of yield and sown area suggest that while yield may be sensitive to bad weather years, such as the wet 2012 and dry 2018, farming has a capacity to shift land between the three cereals to offset the worst the weather can throw at it. Moreover, the yield per unit area of oats has increased to become close to that of spring barley [5].
Despite cereals giving poor economic returns at this time, the system is not mired and should be still able to respond to the inevitable impending change.
External and internal pressures / capacity for adaptation
The cereal- and grass-based croplands of lowland Scotland face a set of internal and external pressures to which they must adapt. They include –
- internal degradation of soil, element cycles and food webs due to intense cultivation, a factor likely to increase pressure on surrounding ecosystems but also to decrease the capacity of land to yield;
- climatic change and extreme events of the type that dented output in 2012/3 and 2018;
- continued reliance on external sources of nitrogen and phosphate fertiliser;
- further pressure on the economic position for mass-market grain, for example, owing to competition from other countries, trade wars and blockades.
One threat that should be no longer feared, however, is that of repeated crop failure, starvation and famine that hit parts of the country as recently as the mid-1800s. And there are increasing positives –
- Greater demand for home-grown cereal products, for example through an increased desire for local, sustainable food and drink.
- Technical innovations in cereal varieties and agronomy that open new higher-value markets.
Retaining flexibility
The line of census records since the early 1880s has shown massive shifts in the total and relative areas cultivated with the species and in the agronomic inputs to those areas. If farming has adapted in a certain way, then it should be able to repeat or reverse the change. There are many options.
- Broad scale shifts in the proportions of crops and grass, possibly reversing in part the shift towards grass (Fig. 3).
- Continued decrease in the area grown with cereals but concentrating on higher-value products or higher yield, i.e. by taking cereals off the less productive land, a trend already apparent.
- Altering the proportions of winter and spring varieties to manipulate the trade offs between yield, inputs and biodiversity.
- Replacement of high-input winter cereals with less demanding spring oats in response to challenging conditions- as happened in the 2012-2013 wet years.
- Reintroducing wheat varieties for milling, for bread, biscuits and cakes, to reduce dependence on imports, and consequently shifting the aims to nutritional quality and away from bulk.
- Growing more ‘mixed grain’ – two or more cereals in the one field – or cereal-legume mixtures such as mashlum that need fewer agronomic inputs [6].
- Introducing grain legumes or grass-legume leys into cereal systems to reduce reliance on mineral nitrogen, improve soil and cut GHG emissions.
Now these might not seem like anything markedly out of the ordinary (when surveying the past 150 years) and indeed they are not. Yet cereal farming in many parts of the world would envy these possibilities: there are vast areas in some continents grown with only one main cereal that offers little scope to engineer change.
Moreover, the climate here, on the Atlantic seaboard, will probably not extend to real extremes due to its oceanicity. Complete crop failure caused by weather is still very unlikely here compared to places (for example) like New South Wales and Victoria in Australia where much of the cereal farming is already at risk without irrigation in a ‘normal’ year, and parts of Africa, where land is abandoned, too dry for growing maize.
Sources, references
[1] Agricultural Statistics 1912. Volume 1, Part 1. Acreage and livestock returns of Scotland, with a summary for the United Kingdom. Board of Agriculture for Scotland. Some data included for the census years back to 1883. And subsequent yearbooks in this series up to 1978.
[2] Economic Report on Scottish Agriculture: 1980 onwards. Scottish Government – links to all data at Agriculture and Fisheries -Publications.
[3] Symon JA. 1959. Scottish farming: past and present. Edinburgh, London: Oliver and Boyd.
[4] Squire GR. 2017. Defining sustainable limits before and after intensification in a maritime agricultural ecosystem. Ecosystem Health and Sustainability 3/8 (open access, available at https://doi.org/10.1080/20964129.2017.1368873
[5] Cereal and oilseed rape harvest: 2018 final estimates. Scottish Government. Published 12 December 2018. Downloads available from link.
[6] For references to cereal-legume mixtures: Living Field posts Mashlum – a traditional mix of oats and beans and Mashlum no more! Not yet.
Author/contact: geoff.squire@outlook.com
Funding The author currently has honorary (unfunded) status at the James Hutton Institute, where he worked for 25 years. A background knowledge of crops, weather and climate was gained previously through funding from the UK Overseas Development Administration and UK Department of the Environment while based at Nottingham University (1970s, 1980s) and more recently through the Scottish Government Strategic Research Programme.
[Page last updated 5 April 2022]


