Analysis of the Report of the Scottish Government CAP Greening Group 2017. Interpretation through DEXi decision trees. Their potential in planning and implementation.
During 2017, a group of farmers, NGO representatives and scientists were asked to consider the current status and utility of Greening measures and options for an improved future system. This article is an interpretation of the group’s report [1] augmented with related discussion, including a much wider examination of CAP Greening by a team from The James Hutton Institute [2].
Concepts and ideas discussed in the Greening group are summarised as a ‘tree’ built in a programme called DEXi, devised by Marko Bohanec at the Josef Stefan Institute, Slovenia [3]. The tree shows two main branches – one in blue in Fig. 1, covering the methods of a future CAP replacement, and one in orange showing the things that the replacement should try to improve, such as the rural economy, biodiversity and appreciation of the countryside.

Fig. 1 Division of the tree: the upper branch, blue, defines how to achieve a future ‘CAP’; the lower, orange, sets out the required economic, biophysical and societal status of a sustainable system.
DEXi trees such as this can be made ‘active’ and ‘worked’ to quantify, compare and rank different schemes .
The structure of the tree, explained below, is not one that the author thinks is final or complete – its aim is to summarise the report and discussion of the Greening group. The author’s preference for a more expansive and integral ‘greening’ will be argued in subsequent articles.
The main branches
The tree begins or ends, because it can work both ways, with an overall appraisal of the reform, named here ‘future sustainable’ [4]. To achieve this state, the methods of future-CAP (branch 1, its aims and incentives) and the desired states of the ecosystem that the methods are designed to achieve (branch 2, the outputs and services) both need to be satisfied (Fig. 2). There is little point in having a great system that encourages farming to achieve a desired state, but that state itself is unsustainable, and vice versa.
Each main branch sub-divides in this case into three (but it could be two or four). Branch 1 needs an overall strategy and design, then a set of assessment and advisory tools and finally a means to make it work. Branch 2 is here expressed through environmental, economic and societal features of the ecosystem. There is no unique merit in this division – branch 2 could be split into the four main ecosystem services or several Sustainable Development Goals or any other overarching frame. In fact, these sub-divisions are simply what the author felt best covered the recommendations of the CAP Greening group – but they could easily be altered.

Fig. 2 Primary branches of the tree into aims & incentives and outputs & ecosystem services, each of which then subdivides into three. Each group of three ‘leaves’ determine the value of a ‘node’ through a utility function.
Each ‘box’ on the tree – named an attribute in decision tree terminology – can be defined by its contribution to an overall sustainable state. In practice, attributes tend to be rated on a three- to five-point scale, e.g. high, medium or low. As the tree is worked rightwards, each box is seen to depend on several other boxes. For example, outputs-services depends on environment, production and societal attributes, and if all these three are rated high, then the branch is also rated high. But what happens if environment is high but societal low. The result is then decided by a utility function. The rules governing each utility function are set by the operators or group of people working the tree.
This working of the utility function is the core of DEXi decision trees. In practice, the function can be changed during a round-table meeting and the result compared. How to do this will be covered in another article. This one will set out the main structure of the tree.
Aims and incentives – how to achieve the desired ecosystem state
The part of the overall tree in blue in Fig. 1 and named as branch 1 in Fig. 2 consists of three main boxes split into further boxes, shown here as a set of hierarchical levels (Fig. 3). Altogether 5 levels are shown from left to right.

Fig. 3 Branch of the decision tree covering aims and incentives of a ‘future CAP’.
One of the sub-branches is described for illustration – the central one ‘strategic / design’. Discussion emphasised the need to have a broad but defined framework in which future-CAP would operate and the need for it to be holistic, i.e. covering a wide range of land management outcomes and their interactions, and inclusive, allowing a range of people both managing and affected by the system to have a say. The framework should be ‘enabling’, which means letting managers decide how to achieve the best result, and both flexible and sensible, allowing managers to vary decisions depending on the season and locality.
Other needs that recurred in the discussion were for greater professional training for farmers and advisers and a set of new metrics by which the achievements were judged. The Result-based approach to agri-environment schemes offers one way to devise such new metrics [5].
As before, utility functions determine the value of an attribute from its dependents. If two proposed schemes are being compared, for example, each would be ranked as to how well they satisfied all the attributes in the boxes. For ‘Advice and training’ to rate high, both ‘enhanced extension services’ and ‘professional development’ would need to rate high (and so on).
Features of a sustainable system
The lower branch in Fig. 1 – branch 2, outputs / services – defines features of a sustainable system. ‘Outputs’ refers to the economic and other products supported by the system while (ecosystem) ‘services’ refers to the functions of storage and cycling of solar energy, water and nutrients among different parts of the system. Generally on this web site, economic products will be regarded as another flow of energy and materials, no different in principle from the main element cycles, but here they are distinguished.
The central sub-branch of 2 is about agricultural production. It is of course highly simplified but shows some of the main topics discussed. Central to the whole debate is the balance between how much comes off the farm and what farming gets for it. The general opinion was that other stages in the quality chain from yield to consumer get more of the benefits than accrue to the farmer. So there is little point in having a profitable crop if the balance is unfair, and to achieve fairness will need buy-in from people and government.

Fig. 4 The branch of outputs-services dealing with agricultural production.
Another sub-branch is named ‘environment’ (Fig. 5), which again shows some of the main topics examined. For example, ‘landscape complexity’ would be ranked according to how well the landscape supported a diversity of plants and animals. Connectivity, including managing across types of landscape, featured highly in discussion. For landscape complexity to rank high, several landscape types, here illustrated by upland high-nature-value farmland and lowland farmland, would each have to each rank high, but then the connectivity between them would also have to be high.
Under ‘reduce adverse impacts’, losses & pollution would need to include all the various processes that lead to a low carbon footprint and therefore high sustainability, while ‘soil & food webs’ would be broken down into many compartments, not just the general one indicated.

Fig. 5 The branch of outputs-services dealing with ‘environment’.
The final branch under 2 deals with ‘societal health & wellbeing’ in terms of food and nutrition, landscape, a sense of place and employment in the countryside (Fig. 6). Taking one of these for illustration, food and nutrition divides into diet and also local production – the latter to capture those aspects of locality and provenance that are considered increasingly important by many people. For ‘food and nutrition’ to rate high, therefore, it will not be enough that the food is nutritious, but it must also be produced with regard for and least damage to nature, and from a short quality chain, rather than one that goes round the world and back.

Fig. 6 The branch of outputs-services dealing with societal health and wellbeing.
The operation of a decision tree
The first task in designing a decision tree is to set out the main variables – the ‘attributes’ in decision tree terminology and the relations between them. The structure of the tree and its attributes shown in Fig. 2 to 6 are based on topics that emerged in the Greening report and related discussion [1]. The author finds that doing this in itself helps appreciation of the range of issues that need to be considered.
For the tree to operate as a decision-aid, each box has to be quantified on a scale, typically 1 to 5 or 1 to 3, or high-medium-low, which defines the degree to which the attribute contributes to a sustainable state. Then the utility functions (see Fig. 2, 3) have to be set that determine the value given to an attribute depending on the value of the two or more that that feed into it. This might sound a little complicated, but in DEXi software, a simple tree such as this, once built, can be worked in an hour of round-table discussion.
DEXi decision trees are mainly used for comparison, so it would now be time to compare schemes, such as two proposed alternatives for future CAP greening. (Before doing that, the author needs to do further checks to consider whether the structure is ‘right’ for the purpose.)
In the meantime, the full branch 2 is laid out in Fig. 7. Even in simplified form, it involves a lot of attributes – but this reflects the complexities of managing land for many outputs and ecosystem services.
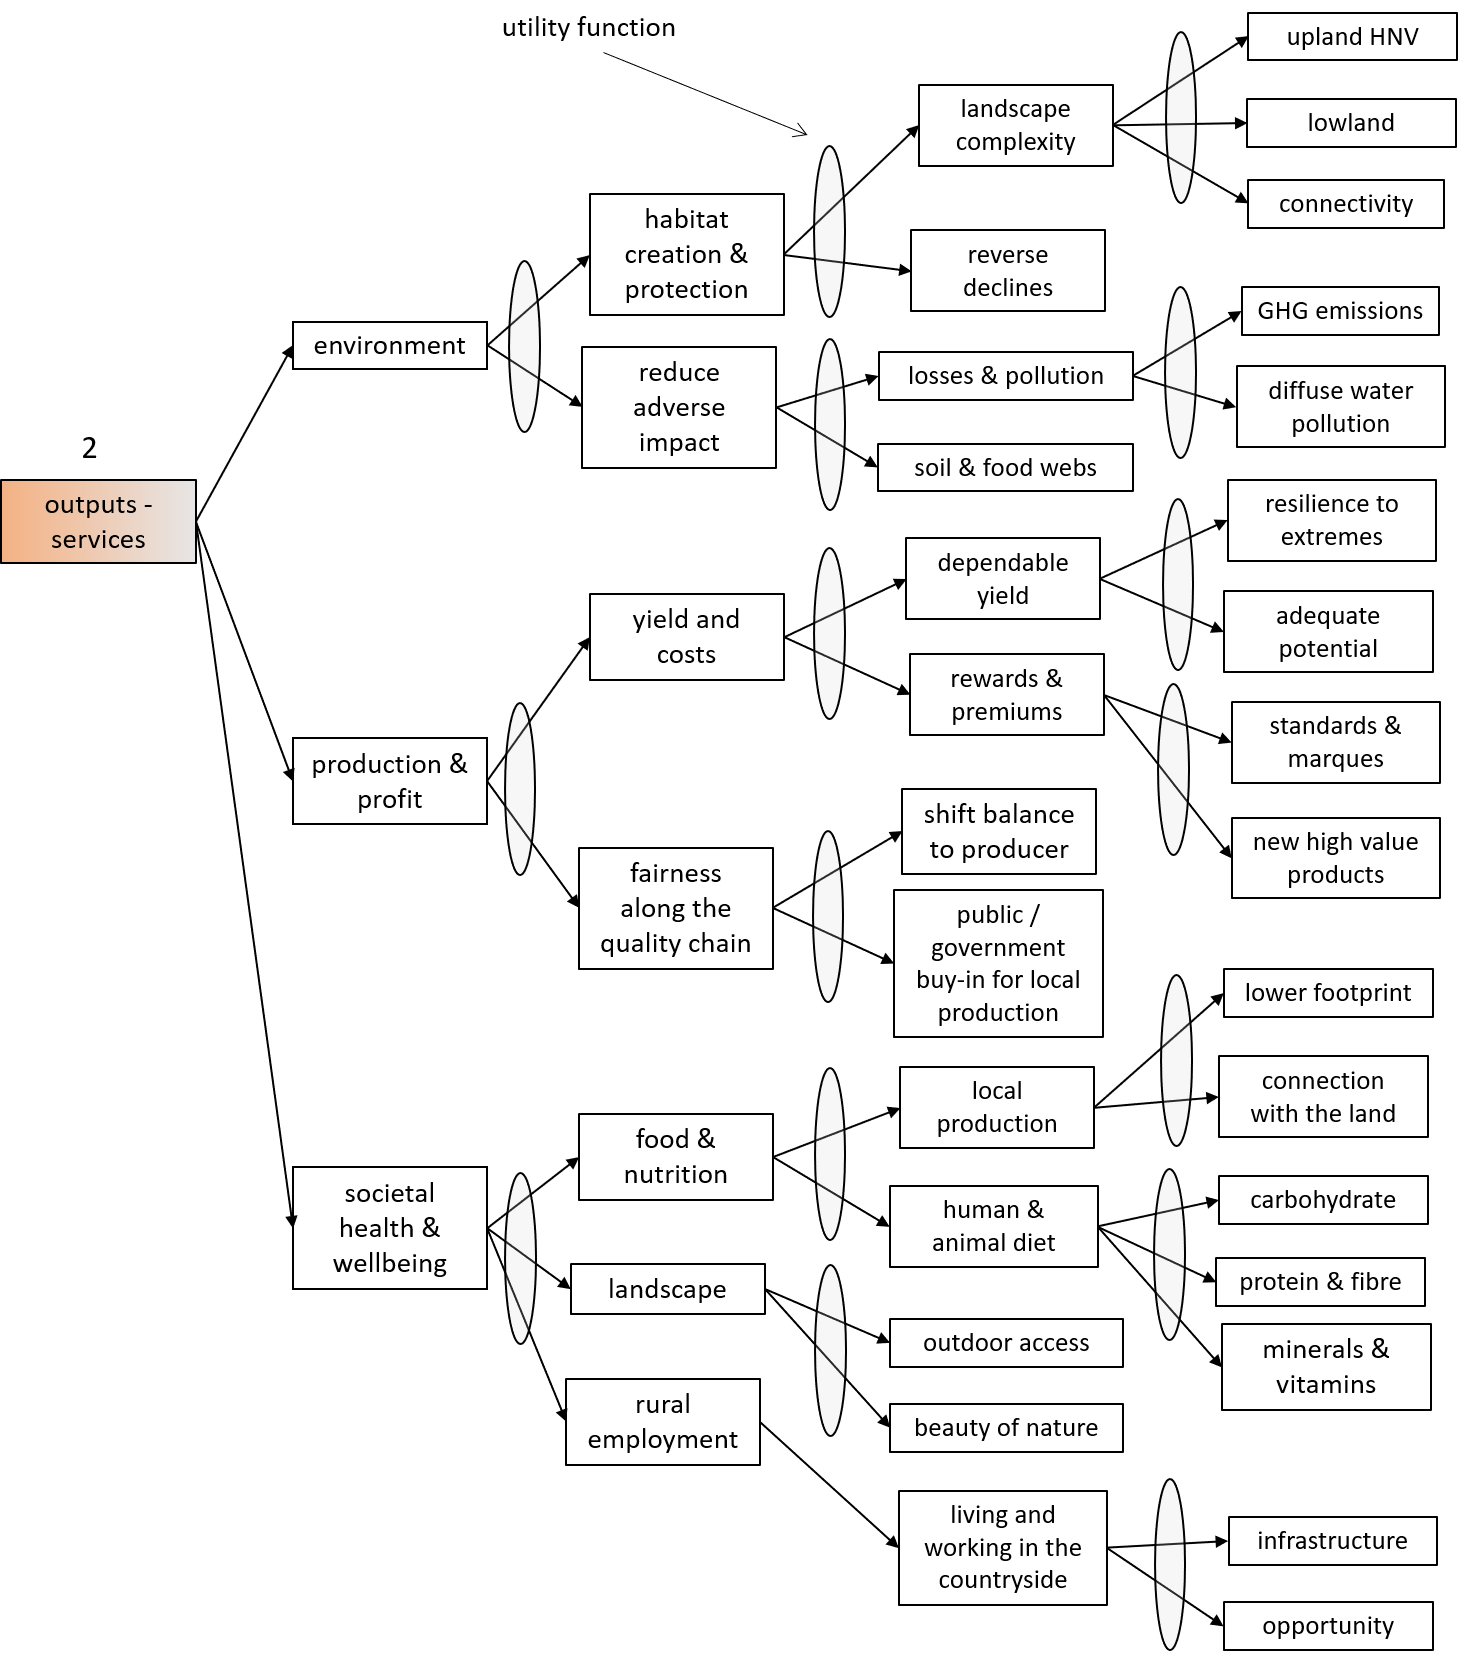
Fig. 7 Branch 2 combining Fig. 4, 5, 6 and showing the utility functions (ovals) that need to be in place to make the tree operational.
Putting numbers on the attributes
As stated, each box or attribute has to be defined on a scale indicating its contribution to a sustainable production system. Decision trees much larger than this have been constructed for comparing integrated pest management schemes (DEXiPM) and production ecosystems. One developed by the author and collaborators is named DEXiES – DEXi for Ecosystem Services. It has hundreds of attributes, most well quantified through years of research in the landscapes of eastern Scotland.
DEXiES has been used to compare high- and low-input cropping and is being extended to HNV grazing. Ratings applied to each attribute are mostly taken from hard quantitative data. For example, in lowland cropped agriculture, soil carbon below 1.5% might be classed as ‘low’ for sustainability, 1.5-3% as medium, 3-4% as medium-high and above as 4% high.
While each of the attributes in the DEXi tree shown here could in principle by quantified in a similar way on a three or five point scale, many of them will not have been thought about in this way – ‘beauty of nature’ for example. Yet experience has shown that a group of people, of diverse backgrounds and interests, could after some debate, rate and rank a greening support scheme in terms of its contribution to sustainability.
Sources, links
[1] Report by the CAP Greening Group available on the Scottish Government web site at CAP Greening Group: Discussion paper.
[2] A major, detailed review of CAP Greening was undertaken by The James Hutton Institute. Findings are detailed in summary and multi-part report available to download from the Scottish Government web site at CAP Greening Review.
[3] Decision trees, multi-attribute modelling and DEXi software at Marko Bohanec’s web site DEXI: a programme for Multi-Attribute Decision Making.
[4] The definition of what is meant by sustainable will be examined in detail elsewhere. Growing cereals and tending stock have been practiced here for 5000+ years and there is no reason in principle why they should not continue for this period into the future. Within the bounds of arguments around CAP greening, ‘sustainable’ means any practice that contributes to such a continuation, which relies on healthy soil and an ecologically well functioning landscape.
[5] For an introduction to Result-based approaches, see Regenerative agriculture : short supply chains.
Author/contact: geoff.squire@hutton.ac.uk
Acknowledgements
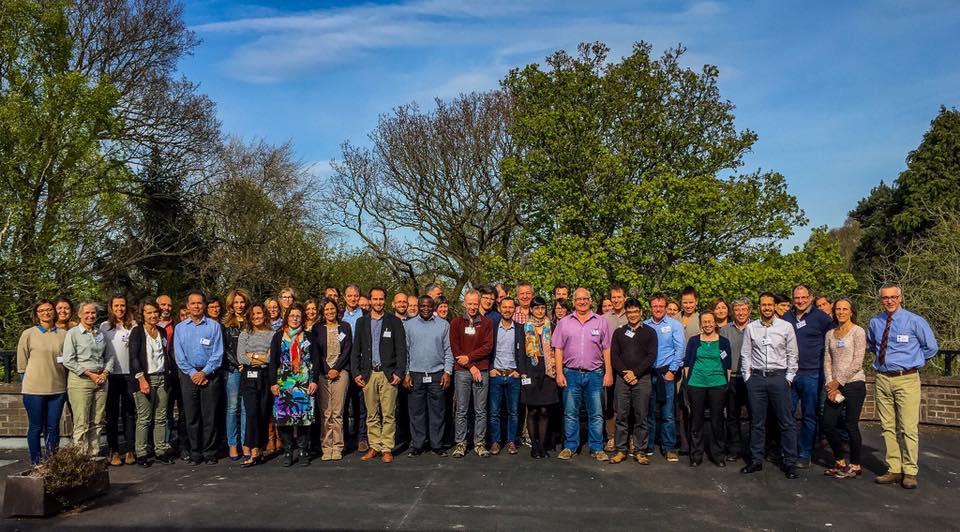
The author (G R Squire) was funded by The James Hutton Institute to take part in discussions of the CAP Greening group [1]. The contribution of a chapter by G R Squire & C Hawes to the Hutton Greening report [2] was funded from the Hutton’s Ecological Sciences group budget.
Again, thanks are to Marko Bohanec for devising DEXi and making it available free of charge.
Posts, articles and blogs on this curvedflatlands web site (including this one) are prepared in the author’s own time.