
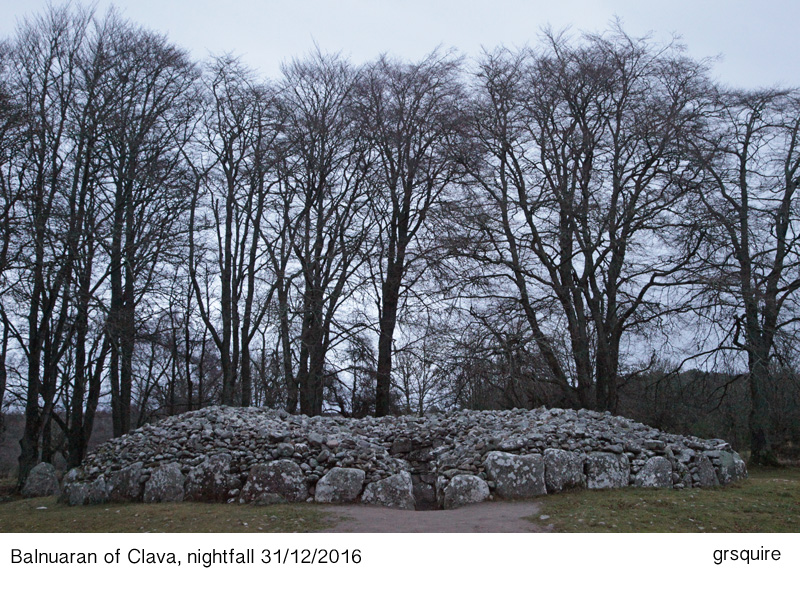
Apologies straight away to those who might be looking for Bronze Age cereal yields … but visits on the same day, the last in the calendar year, to the Bronze Age Clava Cairns and the government web site on the Final estimate of the cereal and oilseed rape harvest 2016 conspired to get the mind to bridge 4000 or more years.
About this time, farming societies then and now had made their calculations and decided what would be needed to last out the winter. Then, of course, in the Bronze Age, cereal farming was well established. It took the lead from the first settlers in the neolithic. It had expanded and organised, but was still reliant on good summers to yield enough grain for beast and human.
Now it’s more a matter of trying to work out whether cereal yields have gone up or down a few percent in relation to the flatlining after the 1990s. The yield per unit area and the total grain output appear to be becoming more sensitive to unusual weather. The wet winter of 2012 caused (what for these regions is) a large drop in yield, and the high rainfall and extensive flooding of last winter might have done something similar.
The Bronze Age, settled, farming societies who lived here and built their monuments, but left little else, had serious strategic issues of life and death at this time of year. There were no ‘root’ crops then, no turnips or potatoes to lie in the frozen ground, but to remain fresh to eat into the spring. Life depended on grain already harvested and stored, and the health and fatness of the stock of cattle and sheep. Life and death depending on barley and wheat.
Today, food security is assured by imports of most of the consumed cereal carbohydrate except oats. The state of the autumn harvest is irrelevant to most people. To farming though, a poor harvest will cut already meagre profits from growing grain, since fertiliser will have been applied to fields well before any threat of bad weather over the summer. And it looks as if bad weather during the summer periods of bulking and maturing of crops and harvest has become commoner in the past two decades.
What’s different?
The annual rainfall has changed over the last 100 years, through the 1900s (Fig. 1). There were several peaks over 1200 mm (1.2 metres) annual rainfall in the period up to the 1950s, then a dry period that lasted to the mid-1990s, but since 1998 there have been 10 years with rainfall above 12oo mm.
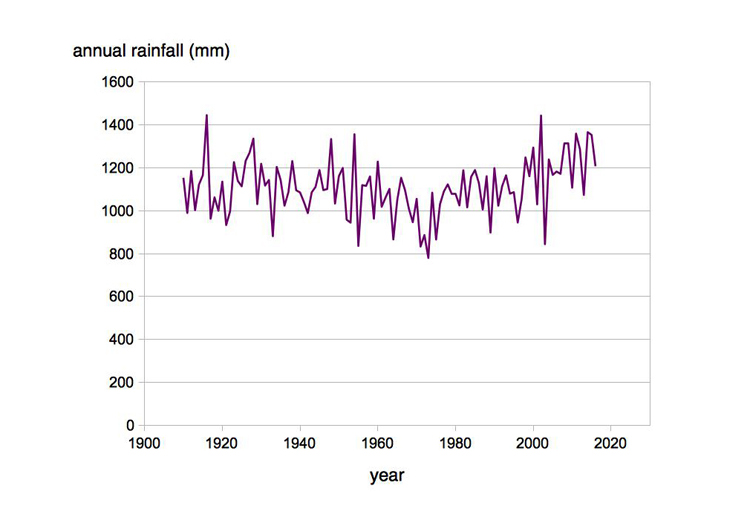
Fig. 1 Annual rainfall 1910 to 2016 in the region Eastern Scotland (source: Met Office UK).
There’s nothing new about wet weather. They would have been soaked at Bronze Age Clava and all places and ages before and since. The significance now is that wet years are reversing some of the advances in yield made during the phase of arable crop intensification from the 1950s to the 1990s.
 The problem is shown by the relative yields after 2000 for three grain crops: wheat, mainly winter varieties, spring barley and oilseed rape. Annual yields are shown as a percentage of the average over the period. The yields drop in 2002 in two of the crops, then remain steady and above average until 2011, drop sharply in 2012, recover to well above the average in 2014 and 2015 then fall to around the average in 2016 (Fig. 2).
There is no relation between the annual total rainfall and the yield. Several >1200 mm years occurred during the steady, above-average period in the central part of Fig. 2. The rainfall in 2002 and 2012 was less than the rainfall in several other years. The factor that caused the drop in 2012 and carried over into 2013 was the timing – there was greater than average rainfall in the late summer and early autumn.

Fig. 2. Grain yield 2000-2016 as a percentage of the average for wheat (red), spring barley (green) and oilseed rape (blue). Source: Scottish Government statistics.
This unseasonal rainfall had four main effects.
Late summer rainfall
The associated cloud reduced the solar income during the summer months when crops are bulking most rapidly: it reduced the actual mass of crop.
The rain kept the crop plants moist in late summer, by physically wetting them and by preventing evaporation and grain drying due to the associated humid air: the grain was slow to mature or became diseased on the plant.
It weakened the soil structure during a time of high field-traffic at harvest: grain was lost or spoiled at harvest and the ground was slaked and compacted.
And it interfered with ground preparation and seedling establishment of the winter crops that are normally sown from late August to October: the same bout of wet weather in autumn 2012 slowed development and canopy expansion of the crops, thereby limiting the next harvest, 2013, which was also well below the average.
[in progress …. month by month comparison, the recovery of 2016, compensation by shifting between crop types]
Sources
Clava Cairns
Historic Environment Scotland gives a brief introduction to Clava Cairns; for detail, the Canmore web portal describes separately the South-west, Centre and North-east cairns.
Barclay GJ. 1990 The clearing and partial excavation of the cairns at Balnuaran of Clava, Inverness-shire, by Miss Kathleen Kennedy, 1930-31. Proc Soc Antiq Scot 120, 17-32. [detail, maps, old photographs]
Rainfall
Rainfall since 1910 for UK and regions. Annual and monthly totals are available from 1910 at the Met Office pages for UK and Regional Series. For example, to view data behind Fig. 1: at the Download site for UK and regional datasets scroll down to ‘Year ordered statistics’ and click the download link for ‘Scotland E – Rainfall’.
Winter rainfall 2015/2016. The following Met Office web article gives a summary, with maps, videos and data, of the very wet November to January: Further rainfall and flooding across north of the UK. http://www.metoffice.gov.uk/climate/uk/interesting/december2015_further Jan 27 2016
Cereal yields
Scottish Government. Final estimate of cereal and oilseed rape harvest 2016. Downloads are available for pdf and excel files. In the excel download, Tables 2 and 3 give cereal and oilseed rape areas, yield per hectare and total production from 1997 to 2016.
[in progress]