An invitation last year to contribute to a series of online discussions about Stone in Scotland’s history [1] rekindled some previous enquiries into the long association of corn and the stone tools used for cutting the crop and grinding its seed or grain into flour [2]. Here is a summary of the topics presented, with links to some background material.
[Draft in progress – 6 July 2026]
- Why corn needs stone
- The ancient practice of grinding seed for food
- The migration of modern cereals to Scotland from the Fertile Crescent
- Stone grinding in Scotland – from querns to powered mills
- Corn and stone – their importance to civilisation and folklore
- End of a partnership? Is there a future for corn and stone.
A note on the word – corn is used here to refer to the seed or the crop of those plant species of the grass family that are commonly known as cereals – including rice, maize, and wheat. Their seed is also referred to as grain. These cereals were not present for most of human history, when at various times in various places, people wild-harvested or farmed other grass species. The seed from these plants is also referred to as grain.
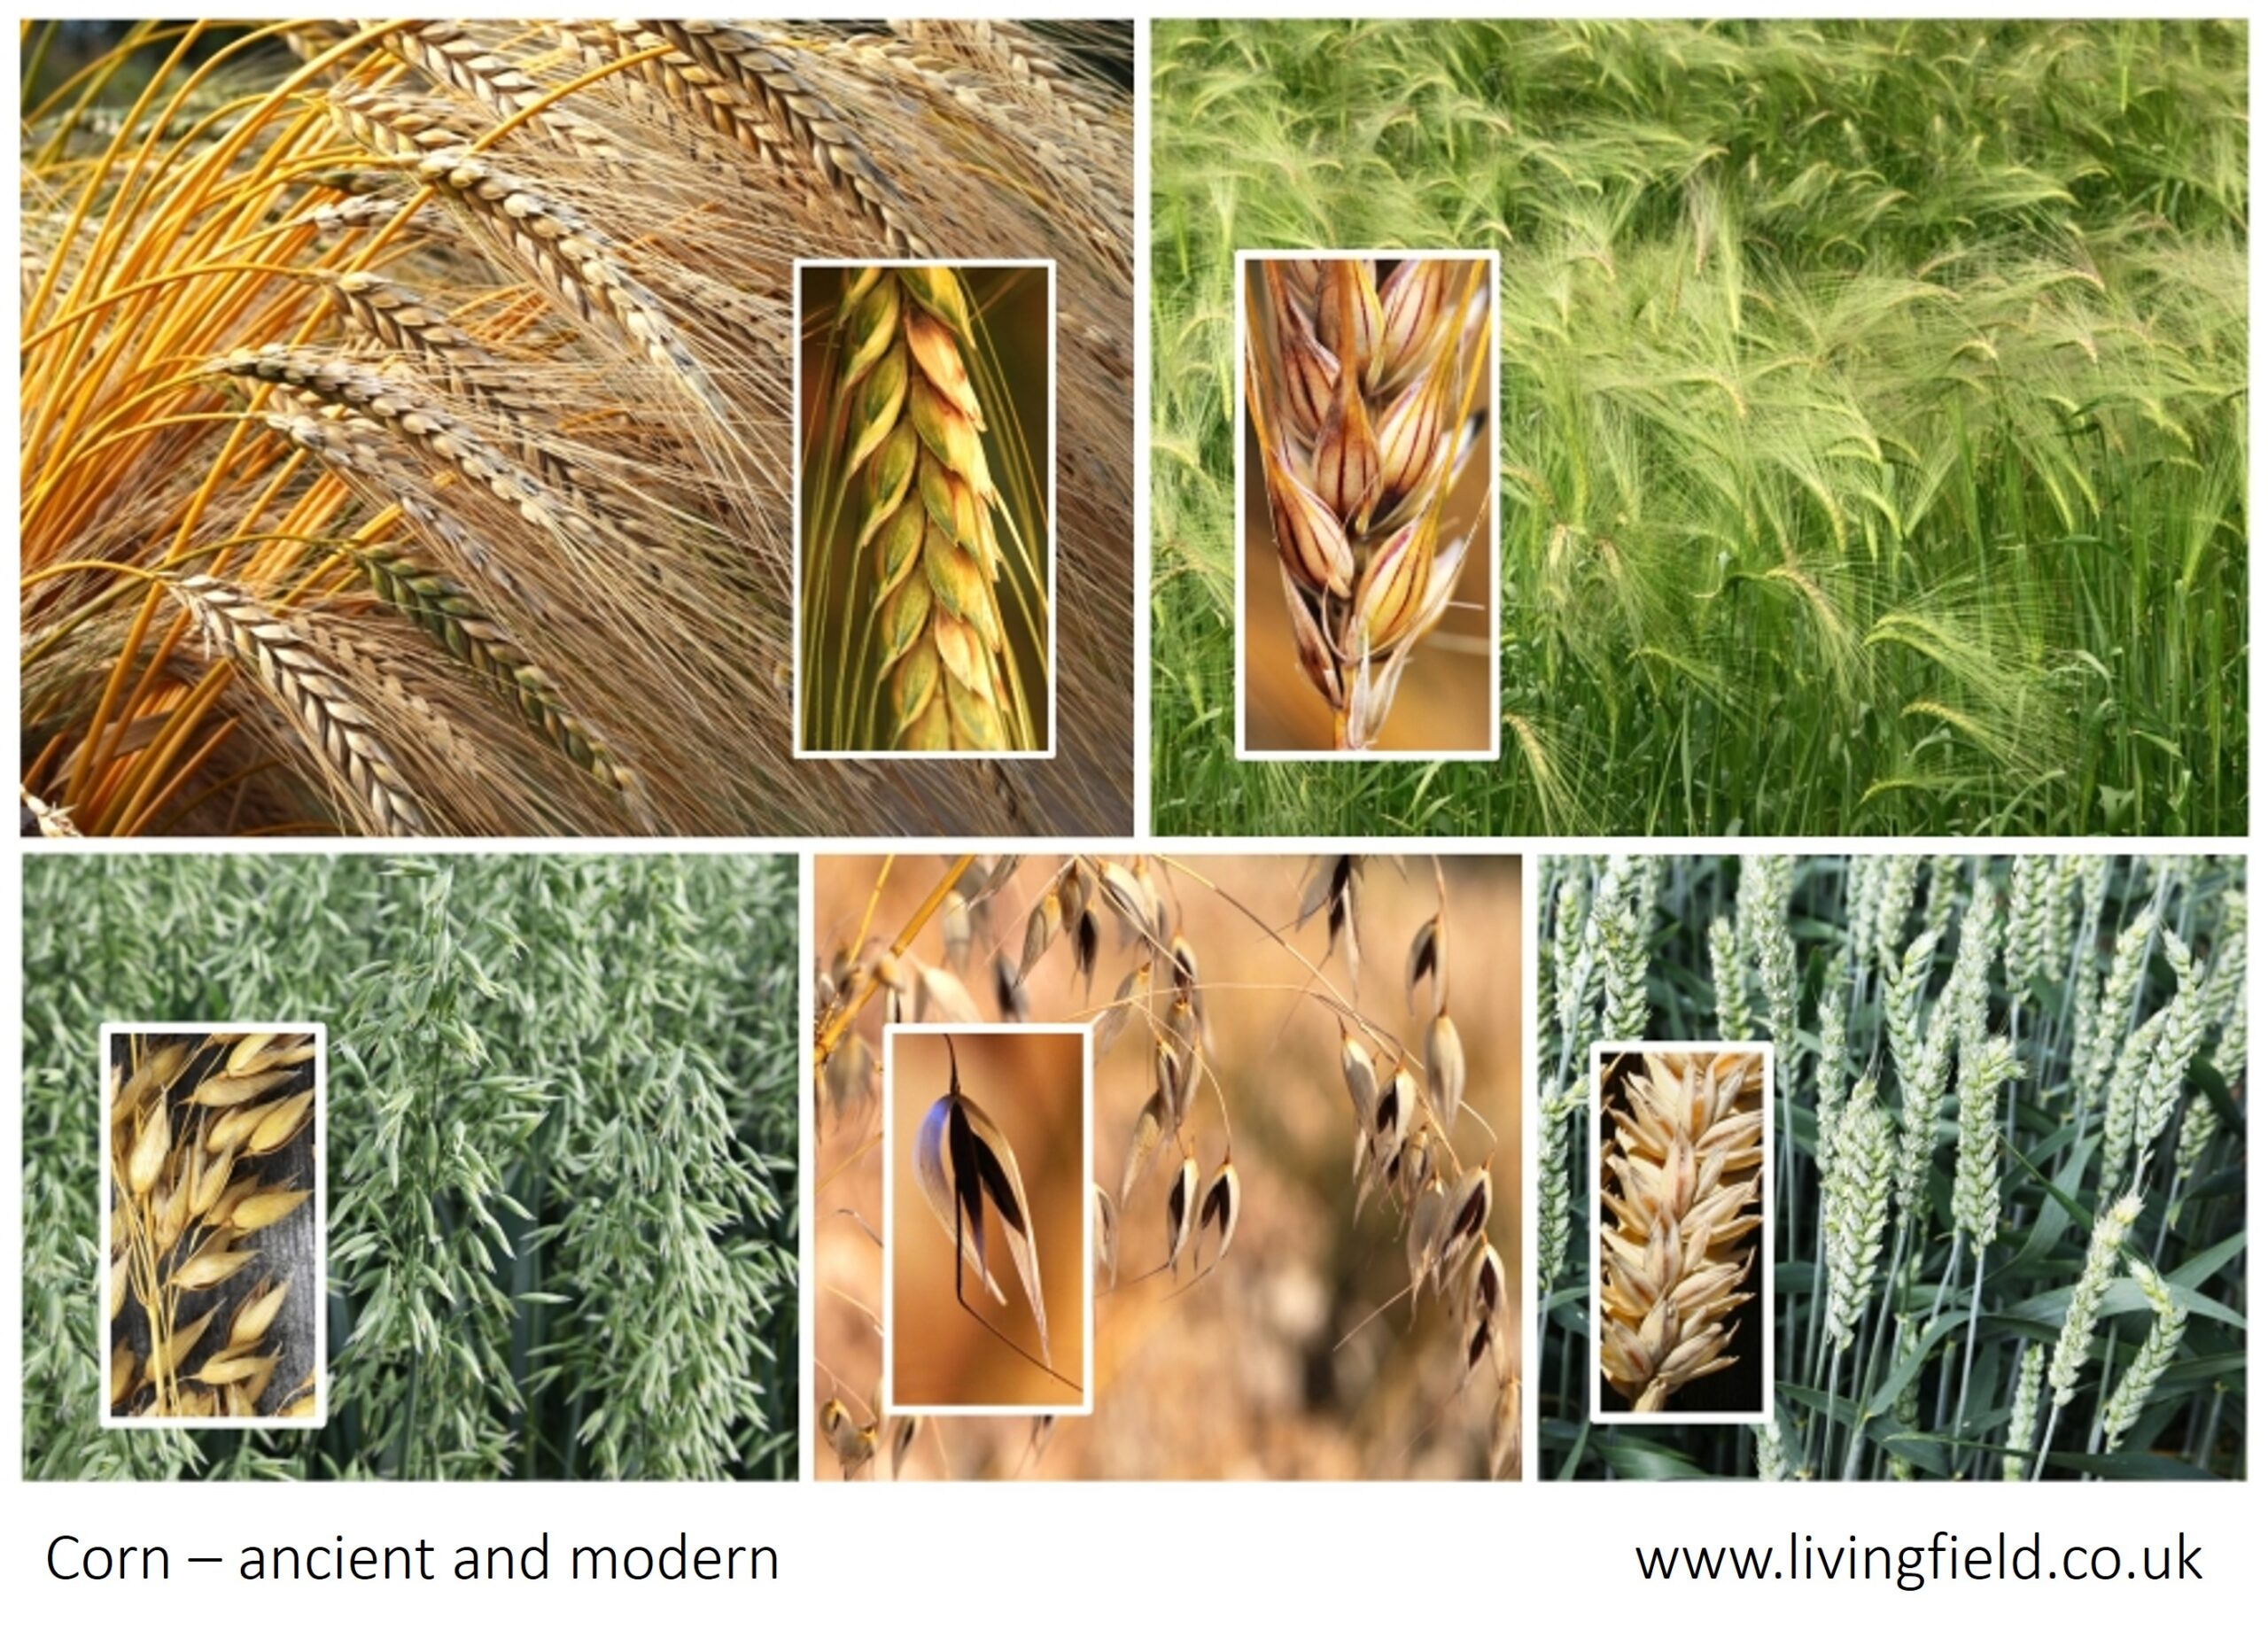
Figure 1. Corn crops: (top left, c’wise) emmer wheat Triticum dicoccum, one of the first cereals to be domesticated in the Fertile Crescent; bere barley, a landrace of Hordeum vulgare; modern wheat Triticum aestivum; black or bristle oat Avena strigosa; and the common food oat, Avena sativa. The insets show maturing grain on the plant. Grown in the Living Field project, James Hutton Institute, Dundee, except the bere crop which was grown for flour on Orkney. [Images: squire @ curvedflatlands].
Why corn needs stone
The history of corn and stone goes back much farther than the origin of corn crops that have been or still are grown Britain (Figure 1). Fields of barley, oats and wheat are common here, and also occasionally rye. These species were domesticated from wild grasses a few thousand years ago and were brought to western Europe in waves of migration. Other cereals were here but are no longer grown commercially – emmer wheat is one such, one of the first to be considered corn rather than grass. Still others were too distant to reach these shores until the last few hundred years – maize from the Americas and rice from east Asia.
Barley oats and wheat were grown and harvested as landraces, maintained by saving seed from one year to the next. One of the very few left is bere barley, a landrace still grown in Orkney. Another maybe bristle- or black oat, eaten in times of privation and sometimes known as famine-food. Most corn grown today is genetically improved and high yielding when supported by machinery, fertiliser and pesticide.
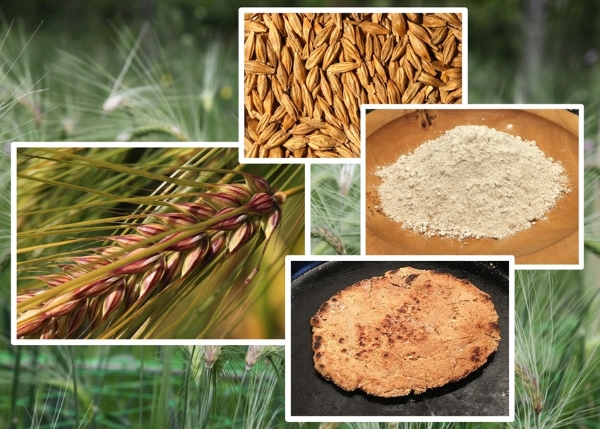
Figure 2. Mature ear of a bere barley crop (left) from which grain (upper right) is threshed, the grain de-hulled and ground into flour (mid-right), and the flour baked into a flatbread (lower right). Background is a field of Orkney bere (Images: curvedflatlands).
Yet the domestication of modern cereals occurred fairly recently in the association between people and plants. Grasses been wild-harvested or semi-cultivated long before people know wheat and barley. And like corn crops today, those plants had structures, mainly of the seed, that made them invaluable as food, yet difficult to process.The seeds are highly nutritious and can be dried and preserved, and so carried as societies move around, or stored to be eaten through times of adversity.
The problem is how to make food out of seed, which when dried is very hard. It can be softened by wetting it to a state that can be eaten or turned to a drink, such as mundified barley or oat sowans [3], but once wetted it soon deteriorates. To survive, people had to process the grain when it was hard and dry and the only material hard enough to smash and powder it into meal or flour was stone.
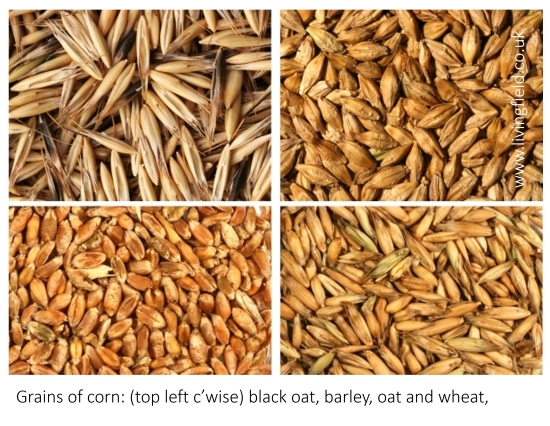
Figure 3. Grains of four corn crops grown at the Living Field, James Hutton Institute: the slender grains of black oat contrast with the bulkier grains of modern barley, oat and wheat. Of the latter, wheat is ‘naked’ while the other two are ‘clothed’.
The sequence is the same today (Figure 2) as it has been for 100,000 years or more. Plants grow and produce seed on a ‘head’ or ear’ which is harvested when mature. The seed is separated from the head by threshing, using variously hand-held implements or complex powered machinery. The awns – the long bristles seen in Figure 2 (left) – are removed, then the seed is then ground between stones, or sometimes between stone and wood, first to remove the seed’s outer covering or husk (when it exists) and then to grind the seed to a meal or flour. The flour can be stored then converted to food by baking or boiling it. The example in Figure 2 is for a local barley and the end-product is a bannock or flatbread – ‘flat’ because’ barley flour does not ‘rise’ like wheat flour.
The seeds of the main cereals have a similar structure but some differ as to whether the seed is covered by a ‘husk’ or ‘naked’ without the covering. The awns and husk offer some protection against animals that want to eat the grain but make processing more difficult. Naked grain has a tendency to fall but is easier to process. Of cereals grown here today, wheat is mostly ‘naked’ whereas barley and oat are husked. But there are variants among the barley – an older variety was recorded as the ‘Scottish four-rowed naked’ [7].
The procedure in Figure 2 is far from simple [4]. It takes time and skill to separate clean grain from the crop. The crucial step is turning grain to flour using some combination of grinding stones.
The ancient practice of grinding corn with stone
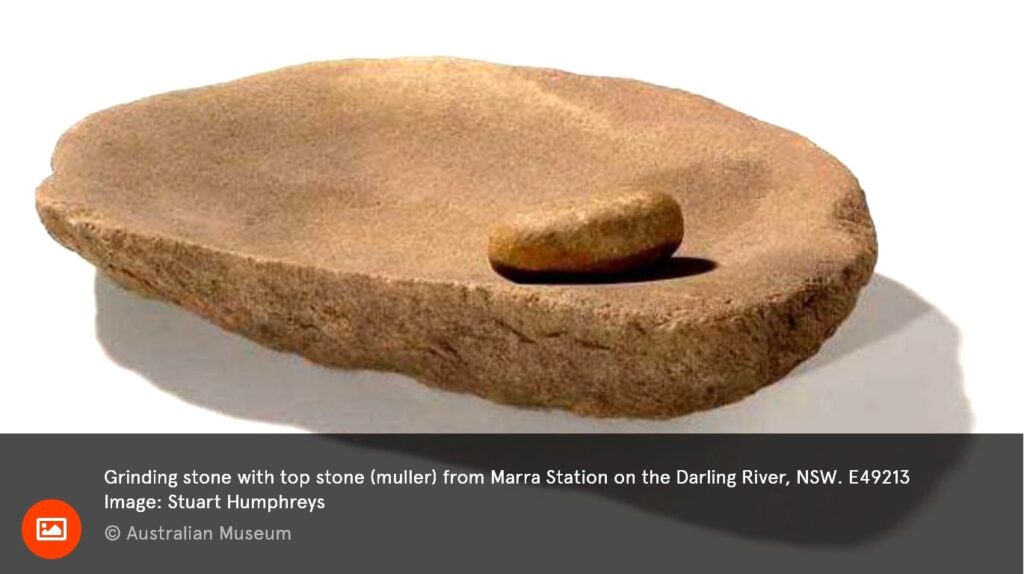
So began a very long period of human existence that relied on this combination of grain and prepared stone. The map in Figure 4 shows some of the archaeological studies that have revealed the early use of stone tools in the preparation of food [5, 6].
The remains of plants found at earlier dated sites, in East Africa and Australia, and those later in Europe (now parts of Italy, Czech Republic and Russia), were of seeds or hard roots of wild or semi-cultivated species [5, 6]. The natural bounty of these plants sustained human life for many thousands of years. Their grain and tubers could be stored, then eaten during migration or when fresh food was scarce.
The term semi-cultivated as used above is based on evidence (both archaeological, and from today’s indigenous practices) which suggests some of these wild species in some parts of the world were ‘farmed’: although the plants were ‘wild’, land was prepared, seed sown, competition reduced and plants harvested [6].
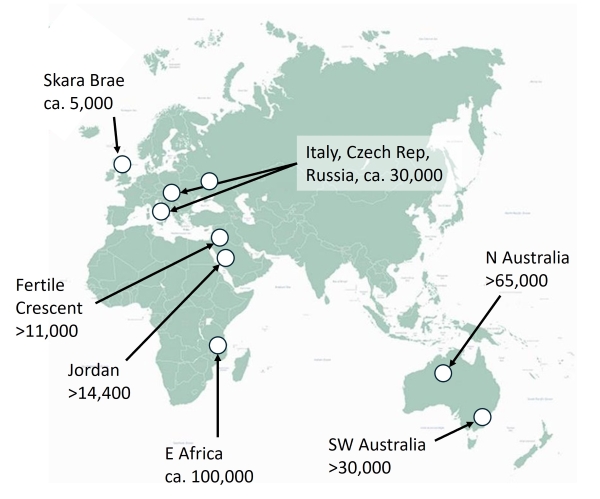
Figure 4. Locations of some archaeological finds revealing the use of stone tools for preparing grain [5]. Numbers show years before the present time. Plant remains at sites before ca. 11,000 years were of wild species rather than domesticated cereals such as barley and wheat.
And then came one of the main events in human history – the ‘domestication’ of modern cereal crops and their cultivation in settled farming. Wheat and barley were domesticated from wild grasses around 11,000 years ago in the Fertile Crescent, east of the Mediterranean Sea. Along with domesticated maize in the Americas and rice in Asia, they became the main carbohydrate food sustaining an expanding human population.
Yet the evolution of farmed cereals in the Fertile Crescent was not a sudden transformation. Evidence of bread-making using grain from wild plants was found in Jordan around 14,000 years ago, and even in the Fertile Crescent itself, people had been using stone sickles to cut and harvest wild grasses well before the cultivation of wheat and barley [5, 6].
Corn in Scotland and the intensification of farming
The growing and processing to today’s main cereals may be viewed therefore as a fairly recent transition in the history of corn and stone. The transition occurred later in Scotland, after retreat of the ice, and with the migration from Europe of people who farmed and settled. The neolithic village of Skara Brae in Orkney is shown in Figure 4 to emphasise the relatively short time over which the main cereals have been grown here.
Corn crops, mainly oat, barley and wheat, and to a lesser degree rye, gave the option of settlement and stability rather than migration. They have been the mainstay of societies here to the present.
Over time, corn crops evolved to suit the local conditions. Seed was saved from the yield at harvest to be sown the next year. They were known as landraces, very few of which, such as bere (barley), are left in Scotland. They usually gave some yield even in years of very poor weather. The corn crop known as black oat (Avena strigosa) was called ‘famine food’ in some places, because most other crops had failed. Black oat was also grown as livestock feed, sometimes fed in bulk without processing (Figure 5).
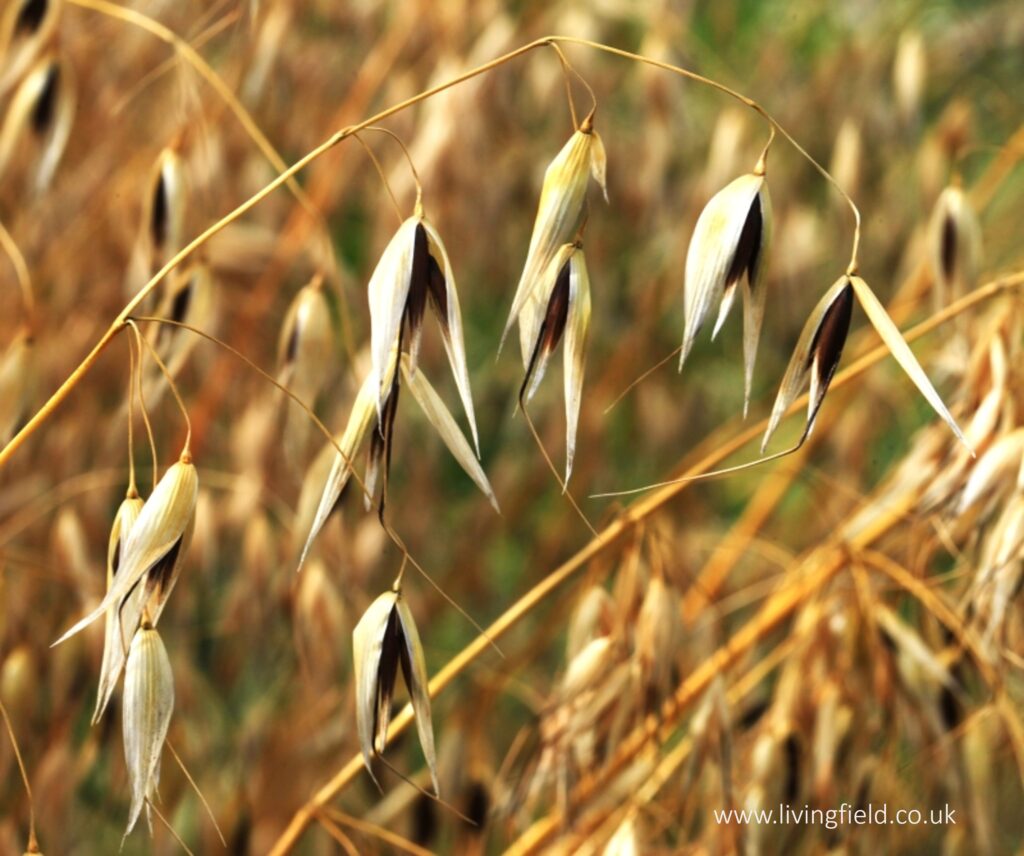
“… through to the early 1960s, we know that some of the corn grown at Auchindrain was an ancient type known as Black Oats that grew well in the Argyll climate. Harvested slightly green, it dried in the stook before being stacked …. in the winter the harvested oats were fed whole to the cattle … ” [8]
Figure 5. Black oat, plant near-mature, grown at the Living Field at the James Hutton Institute near Dundee. The quote is from one of the display boards at the Auchindrain Township by Loch Fyne [8].
Oats and barley came to be the main staple cereals in the diet, while wheat, needing more inputs, was less widely grown. As well as locally evolved landraces, new varieties were brought in from around the world, trialled here and adopted if successful [7]. Stone grinding tools also evolved from querns to mills powered by water, steam and electricity. Over the millenia, corn crops and their milling became embedded in folklore and folk song. Tales of the apocryphal legend of John Barleycorn are still sung today (Figure 4).
Yet the pairing of corn and stone has all but come to an end. New technologies introduced since the 1950s raised the yield in the Atlantic croplands to among the highest globally for long-season (over-wintered) crops. Yet Scotland (and the UK as a whole) still relies on imports of corn grown elsewhere [8], whether wheat from Europe or maize and rice from further afield. And the tools and machines for processing grain also evolved, such that corn seed is now mostly processed without stone in efficient high-tech factories.
Globally, large areas of natural and semi-natural ecosystems have been replaced by corn-farming that produces high yields for global commodity chains. Much of the crop goes to alcohol and livestock feed as well as food for people. The high intensity of most cereal agriculture causes widespread pollution and degradation of soil. This is not inevitable – good yields of corn can still be achieved at the same time as building soil, reducing inputs and supporting biodiversity.
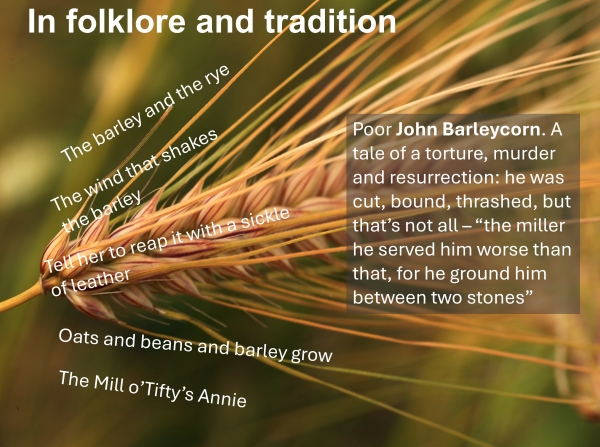
Figure 6. A maturing ear of bere barley adorned with lines from various folk songs that include mention of corn crops, usually barley, and milling; and inset the apocryphal tale of the death and resurrection of John Barleycorn.
Most people no longer know corn, yet still eat it in many guises. Will corn and stone reunite and continue to evolve together? We’ll look at the possibilities later in this article.
To be completed
Part 2. Migration of Corn (and Stone) to Scotland; developments in grinding stones from querns to water powered mills.
Part 3. Corn growing as the basis of civilisations, from the neolithic onwards; corn in folklore, poetry and song; the end of the partnership – corn and stone no more! Well, perhaps not – what would John Barleycorn do?
Contact: curvedflatlands@outlook.com
Sources | Links
[1] Thanks to Magdalena Blazusiak of Robert Gordon University (RGU) for the invitation to contribute to Stone Futures 4 – Stone Stories, held online 2 February 2026 as part of a series of talks titled Stone Futures, organised by the Chartered Institute of Architectural Technologists (CIAT), Scottish Ecological Design Association (SEDA), and Historic Environment Scotland. Geoff Squire joined Amy Wilson (RGU) and Magdalena Blazusiak to give presentations and discussion at lunchtime on 2 February. Further information on the session is given at the CIAT and SEDA web sites, where there are also links to the recording.
[2] The author of this article, Geoff Squire, has a long interest in various forms of corn and their influences on the world’s managed ecosystems. He worked in the 1970s and 1980s on the tropical corn crops – millet and sorghum – and also our local wheat, then continued from the mid-1990s to investigate barley, oats and wheat mainly in Scotland but also in other parts of the UK and Europe. Recent open-access papers covering corn crops in the ecosystem include: Squire, Hawes (2024) Biodiversity for agriculture: the role of integrated farm management in supporting agricultural production through biodiversity. Book Chapter BDS Publishing: link to free download; and Squire, Young, Banks (2023). Post-intensification Poaceae cropping: declining soil, unfilled grain potential, time to act.
[3] The seeds of cereals and other edible plants have been moistened to initiate conversion to soft food or drink, and not just alcoholic drink. Until recently in Scotland, for example, cereals such as barley and oat were converted to nutritious drinks – see for example mundified barley on the Living Field web.
[4] Small and large-scale processing. Farmers and communities growing corn on a small scale had to master the many steps in the process of turning harvested grain to flour. The process was common in Scottish crofting and small-scale farming but has now largely died out. To support revival of the methods, Seed Sovereignty UK and Ireland, part of the Gaia foundation, has detailed methods and machines used historically, based on the collections at the Highland Folk Museum. A PDF of the report is available online: Croft Scale Equipment used to process grain. A historical perspective and route to revival.
Some ancient grains are finding new usage in larger-scale, low input agriculture, but they still need careful processing. One of the main steps is removing the ‘hull’ or outer covering around the grain. The following article considers the methods and equipment for taking the hull off grains of emmer, spelt and einkorn. Baker, B. (2015) Dehulling ancient grains: economic considerations and equipment. eOrganic web article available at https://eorganic.org/node/13028. See also [8].
[5] Scientific articles on the archaeological evidence for the use of stone tools to process seed and corn. Most articles are available for free download from the links given to a journal’s web site. In alphabetical order of first author.
Clarkson, C. et al. (2017) Human occupation of Northern Australia by 65,000 years ago. Nature Vol 547, doi:10.1038/nature22968
Jenifer, J.; Bell, T.L.; Khoddami, A.; Pattison, A.L. (2023) Panicum decompositum, an Australian native grass, has strong potential as a novel grain in the modern food market. Foods 12, 2048. https://doi.org/10.3390/foods12102048
Maeda, O. et al. (2016). Narrowing the harvest: increasing sickle investment and the rises of domesticated cereal agriculture in the Fertile Crescent. Quaternary Science reviews 145, 226-237.
Revedin, A. et al. (2010) Thirty thousand-year-old evidence of plant food processing. PNAS 107 (44), 18815-18819. http://www.pnas.org/cgi/doi/10.1073/pnas.1006993107
[In progress: to be continued.]
[6] Anthropologists are reassessing the use of wild and semi-cultivated plants long before modern cereals were first cultivated around 11,000 years ago. Here are some web links to studies in Australia that describe archaeological sites, plant species harvested, and stone grinding tools to convert seeds to meal or flour.
Floreck, S. (2014) Food culture: aboriginal bread. Australian Museum web site: https://australian.museum/blog-archive/science/food-culture-aboriginal-bread/
Australian Museum (2021) Wailwan grindstone. https://australian.museum/learn/first-nations/unsettled/unsettled-introduction/wailwan-grindstone
[7] Since the first corn seeds arrived here thousands of years ago, crop varieties from around the world have been grown and tested in Scotland. In the 1800s, the Edinburgh seed company Lawson and Son assembled a major collection of seed for the Great Exhibition of 1852, described in detail in their compendium Synopsis of the Vegetable Products of Scotland. For links to Lawsons’s Synopsis – see Bere line -rhymes with hairline on the Living Field web.
[8] The Auchindrain Township – visitor centre and museum – by Loch Fyne in Argyll, has display boards showing harvesting and processing of corn crops: https://www.auchindrain.org.uk/
[9] Further information on corn and cereal crops. Both curvedflatlands and Living Field web sites offer background information on corn. The link to the Bere line above leads to a range of articles on landraces, traditional food from local corn, the effects on yields due to recent climatic shifts and wars (e.g. Global wheat – status now) and wider views of crops not grown here such as Rice.