Community mapping – food, climate

SEDA Land’s mapping initiatives. Communities, landowners, science, technology, computer gaming. Food sourcing and food security. Local vs global. Spatial data and the need for local knowledge. Building resilience to global disruption.

SEDA Land arose from the Scottish Ecological Design Association’s 2021 Land Conversations as an active and inclusive grouping intent on exploring and then influencing the way we value and manage land and water [1].

One of the first developments from the Land Conversations was an idea to ‘map’ the land around a place or community for its capacity to provide for the people, now and in the future. That capacity included food, water, wood, open space and a sense of place. The ideas quickly developed and by early 2022 took form through collaborations between many people and organisations in a project called Mapping Future Food and Climate Change.
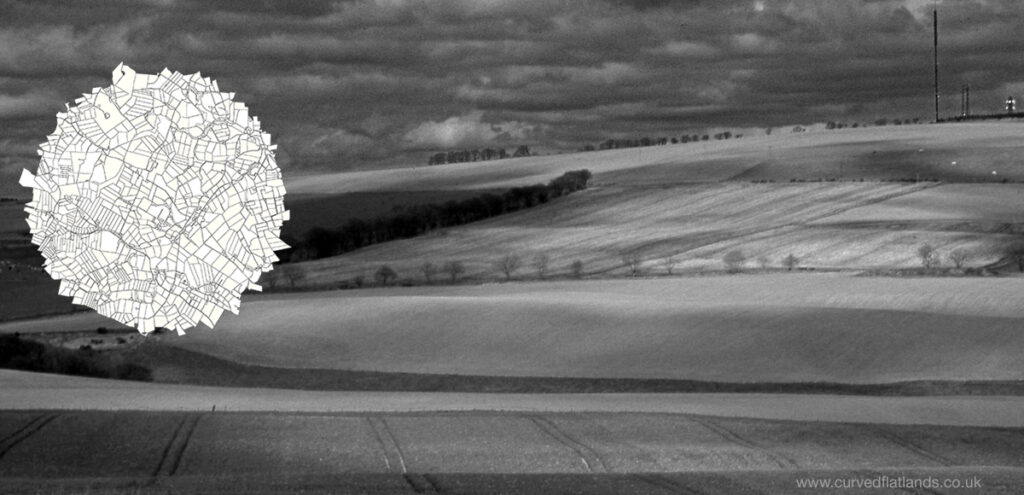
A map of fields (inset) on a farmed landscape, Aberdeenshire (original photograph by GS).

Community – land – science – art – gaming

A pilot study began in 2022, based on the locality of Huntly, comprising a range of community groups, schools and local landowners [2]. Scientific institutions are providing knowledge of soil, crops, food, carbon storage, greenhouse gas emissions [3] and expertise in computer gaming [4]. The main elements of the pilot study are as follows.

  • The land in and surrounding the town, and its nature, shape, occupancy, community involvement and ownership.
  • The biophysical status of the land, its climate and weather, bedrock and soil, carbon storage, biodiversity.
  • Structure of the land – mapping ‘parcels’ or units of management (e.g. fields, woods) and what they produce or contribute.
  • The community’s use of locally-grown products versus the import of things grown on resources elsewhere.
  • The meaning of the land to the people, expressed through tradition, art craft, music [1].
  • Definition and analysis of spatial and temporal ‘layers’ (e.g. area, soil, climate, use, inputs, outputs) to understand the current value and limitations of the land and its future potential for delivering benefits such as food security, C sequestration, biodiversity and community involvement.
  • Expressing all of the above through computer gaming.

But where do we begin … ?
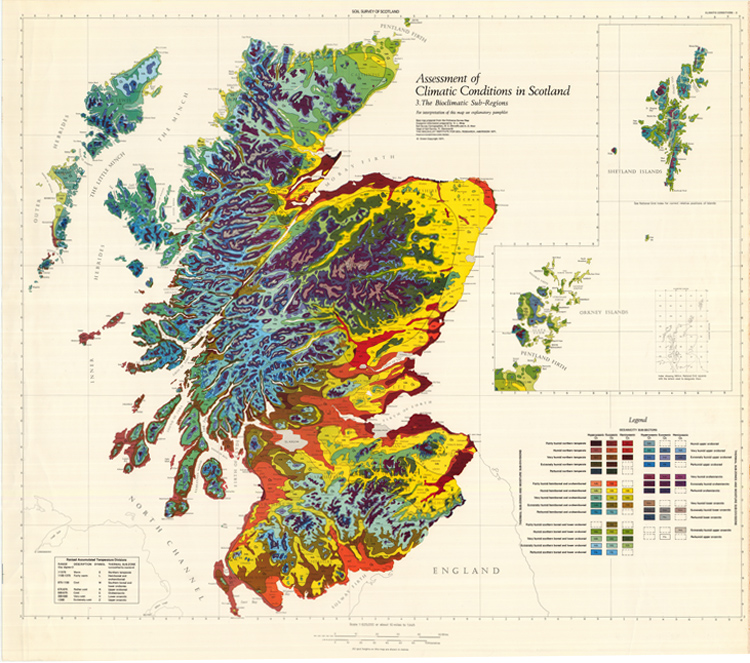
Fig. 1 Map of the Climatic Conditions in Scotland, published 1970-72 by Birse and colleagues at the Macaulay Institute for Soil Research [5].

Mapping the biophysical, economic and political landscape of Scotland has a history going back several hundred years. The climatic maps produced in the early 1970s from the Macaulay Institute for Soil Research (Fig 2) are among the most spectacular. The arable-grass agricultural land lies mostly in the red and yellow areas around the east coast and across the central belt.

In the half-century since Fig. 1, digital maps have become the norm, now available online for many features – including land classification, soil and soil carbon content, erosion and compaction risk, and land suitability for agriculture and forestry [6]. The study based around Huntly will be able to use the maps, and the data behind the maps.

Fig. 2 An area of land, a few kilometers in diameter, in which the individual parcels are identified, each having the potential for distinct and different land use [7].

Mapping land and land use

The patterning of the land is one of the first things to appreciate, and in particular the division of the land into the units of management. Why is this important? Well … suppose three fields have similar soil, slope (etc.) but one is woodland, another is grassland and the third is cropland. They all differ in what they produce, their agrochemical and mechanical inputs, the carbon they store, the biodiversity they support and what they conserve or release to the wider environment. Therefore the management of the field is just as important as its underlying qualities.

Mapping fields and other land parcels in fine detail is now possible (Fig. 2). Their shapes can be made visible and to a large degree, but not completely, the use of the land in each parcel can also be defined. Without even visiting the area, the parcels containing established vegetation such as woodland and marsh can be identified from remote sensing and each of the agricultural parcels can be separated into grassland and arable (or cropped land) using data from government census.

The sequence of crops grown in an arable field can also be defined, and from that, combined with data on soil, climate, outputs (yield, etc.) and inputs (agrochemicals, etc.), the capacity for carbon storage end emissions can be estimated or modelled.

Let’s get on with the mapping.

Fig. 3 The parcels of land in Fig. 2 supporting grass for livestock grazing (left), crops such as barley (centre) and a variety of other uses in agriculture and forestry (right) [7].

Given the right information [7], the shapes can be coloured to show the different forms of land use. In the example in Fig. 3 – based on the field patterns in Fig. 2 – the first to go in is grassland (Fig. 3 left), then tilled or arable land (centre) and third, the remaining areas consisting of woodland, vegetables and fruit, minor crops that occupy relatively few fields, and also semi-natural vegetation (right).

When all land parcels have been identified, the map looks as in Fig. 4: a complex mosaic of land use types that gives the Atlantic zone maritime its unique features. Some of the patterning originated hundreds, even thousands of years ago. Like much of lowland Scotland, and despite removal of the original vegetation, the fields are diverse in size and shape, with little evidence of prairie agriculture that continues to degrade so much once-natural land in many parts the world.

Fig. 4 The three parts of Fig. 3 brought together, where each colour represents a distinct type of land use [7].
Limits to data – the need for local knowledge

Because of the way land use has been recorded historically, the arable fields can be defined by the crops grown in them, such as barley, oats, wheat, beans, peas, oilseed rape, potato, turnips, and so on. However, grassland – which often occupies the most land in regions of lowland Scotland – tends to be lumped in just a few categories. In the current census, the two categories are grass present in a field for under 5 years and grass in its fifth year and over. This lack of definition in grassland obscures the great variation found across Scotland’s managed grass in terms of biodiversity, soil carbon content, fertiliser inputs, greenhouse gas emissions and grazing potential.

Several other factors important for the study cannot be gained from current surveys. It is not possible to know from remote sensing or census data the quality and purpose of the product and whether it is consumed locally or exported from the area. For example, a field of cereal (barley, wheat or oats) could be used for malting (alcohol), livestock feed or milling to produce flour. The cereal feed might be given to livestock on the same farm or sold to a merchant to be used in another place. Even much of the grain used for milling – though small in quantity compared to malting and feed – will be sold to merchants for distribution elsewhere.

And it’s not possible to know what the landscape means to the people who live in the area. So for these unknown or uncertain features, we must add in local knowledge ….. that provided by the general community and the people that manage the land.

Next steps

SEDA Land, the Huntly Community interests and the academic partners are now looking to obtain grant funding. In the meantime, several of those involved will be scoping the digital mapping and other background data available online and members of the mapping group (1-4] will be getting to know each other through meetings, real and virtual.

By way of introduction to the project, SEDA Land is preparing a set of questions asking people’s perceptions of what the land around Huntly provides – for example, how much food and timber is grown locally rather than imported. The questions are intended primarily for schools but will be available to any in the community.
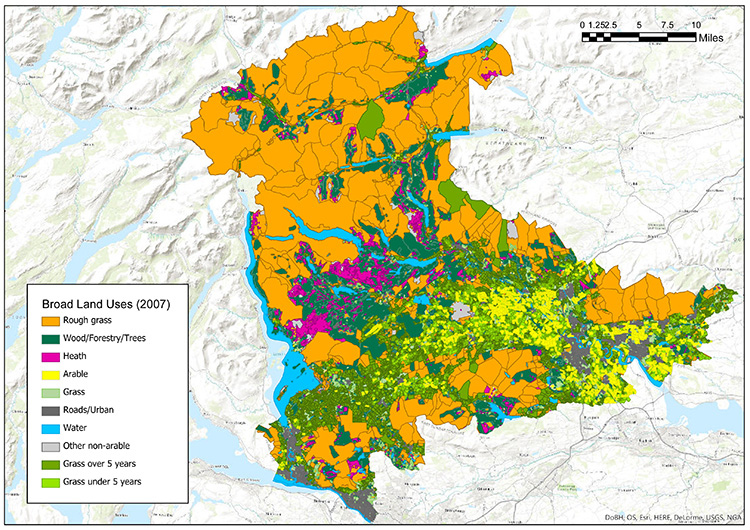
Fig. 5 Map of a region in Scotland showing land in broad categories: the lower altitudes support arable (crops) and grass, shown in green and yellow; the higher reaches, especially to the top of the image holding mainly rough grazing. Map prepared by the James Hutton Institute as a contribution to Nourish Scotland’s work on food systems [7].
Spatial scales and land categories

One of the first things the group will consider is the spatial scales at which data will be recorded and the categories into which land is divided. An example of broad land use categories is given in Fig. 5, which represents a tract about 30 miles at its widest. This sort of mapping gives a quick guide to the general possibilities for food and timber production. Green and yellow is already under managed agriculture. Orange, which covers more than half the area, is of low productivity, mostly used for extensive grazing of sheep, but offers possibilities, for example, of woodland regeneration.

Fig. 6 An area of land, lower altitudes to the bottom-right containing many small fields (average area around 7 ha), rising in height to large units of more open moorland at the top [7].

Much finer detail can be defined, as in Fig. 2-4, giving clues as to how local topography, soil, microclimate and past management determine the patterning of fields and what can be grown in them.

The fields and other units in a tract of land a few kilometers wide are shown in Fig. 6. The area to the bottom of the image, comprising many small fields, has been in agricultural use for thousands of years, but records exist of its conversion into high-quality arable and grass from the time of the monastic improvements beginning in the 1200s. The top of the image is higher land which would have been woodland in prehistory, but now comprises large units of open moor or rough grazing. The strands of small fields running down from the moorland identify water courses. Fig. 6 is taken from the upper left of the larger area shown in Fig. 7.

The scientific contributors will assist with defining scales and data, but anyone with interest in the project can begin now with online and free-to-use mapping through the National Library of Scotland and Ordnance Survey [8].

The curvedflatlands web site will be publishing further news, posts and comment over the coming months and maintains a growing inventory of relevant data sources [9]. The SEDA Land web pages [1] will be the formal point of contact for the project.

Fig. 7 Fields and other land units delineated over a landscape bordering the sea (in white), two crop types identified by orange and yellow colour; width 47 km. From work by Nora Quesada, Graham Begg and Geoff Squire at the James Hutton Institute [7].

Sources | Links

[1] SEDA Land is part of the Scottish Ecological Design Association: https://www.seda.uk.net/seda-land. A working group within SEDA Land, including all the participants, is taking forward the work on community mapping. Primary contact for the project: Gail Halvorsen, email: gail@halvorsenarchitects.co.uk. As in the Land Conversations, writing, poetry, art, craft and music will be integral. Contact: Sophie Cooke (sophie.cooke1@open.ac.uk).

[2] Primary contact: Huntly Development Trust www.huntlydevelopmenttrust.org. Email: Jill Andrews (jill.andrews@huntly.net). Local schools and landowners are active in the project.

[3] The scientific input is guided by the James Hutton Institute and Scotland’s Rural College (SRUC). Contacts at JHI: Lorna Dawson (lorna.dawson@hutton.ac.uk) and Cathy Hawes (cathy.hawes@hutton.ac.uk). Contact at SRUC: Mads Fischer-Moller (Mads.Fischer-Moller@sruc.ac.uk).

[4] The University of Abertay, Dundee, will be working towards gaming design through a post-graduate student group starting later in 2022. Contact: Kenneth Fee (k.fee@abertay.ac.uk).

[5] E L Birse and colleagues at the Macaulay Institute for Soil Research (now part of the James Hutton Institute) produced three classic maps on the Assessment of the Climatic Conditions in Scotland. The one shown is the last of the three, credits as follows:

[6] The James Hutton Institute’s online resources: Scotland’s Soil Data and other maps accessible from that page .

[7] Data for defining land use (crops, grass, etc .) in Fig. 3, 4, 5, 6 and 7 came from EU’s Integrated Administration and Control System (IACS) and was spatially analysed by Nora Quesada, Graham Begg and Geoff Squire at the James Hutton Institute. The maps in Fig. 4 and 7 were published some years ago on the Living Field web site at Scaperiae. Contact: graham.begg@hutton.ac.uk.

[8] Online map resources The National Library of Scotland has an increasing range of historical maps available online at the Map Images Homepage. The Ordnance Survey’s extensive downloadable resources are at Open Data Downloads and for education, see Free Education Resources for Teachers, and Digimap for Schools.

[9] curvedflatlands is compiling an inventory of mostly online data on land, soil, vegetation, biodiversity, climate, etc., which will be updated as new material becomes available: Sources of Information.

Author / Contact: GS has been working with SEDA to develop the 2021 Land Conversations, is on the steering group of SEDA Land and keeps (honorary) links with the James Hutton Institute. email: geoff.squire@outlook.com or geoff.squire@hutton.ac.uk

[Page online 10 March 2022, minor edits 27 March 2022]

Food security in the pandemic

Not long into the 2020 pandemic, Pete Ritchie from Nourish Scotland, wrote a blog [1] putting the case that once the initial panic has receded, the international food system would adapt, the empty shelves would be re-stocked and no one in this country ought to go hungry. Nourish, through their blogs, web sites and conferences are at pains to point out that no one should go hungry in the UK because of shortage of food. Should they be hungry or malnourished, it would be due to other factors, such as social inequality, not the amount of food available.

Nourish were correct, but they were not giving the thumbs up to the current state. The blog writes that the food system – “ … generates massive environmental damage, monumental food waste, exploitative work practices and a disastrous mismatch between what we need to eat for health and what we are being sold.”

Dysfunction and mismatch are not simply other people’s problems. The blog continues – “ …..it would be good if Scotland were to produce more of what it eats, and eat more of what it produces.”

The blog raises the greater issue of the choices that can be made – whether to create a more equitable food system or stay with the current dysfunctional mix of hunger and plenty. Analysis by the Food Foundation [2] shows the pandemic is driving more people into malnutrition and hunger: the food is there but many people are unable to afford it or get to it.

Yet on the continuity of supply during the pandemic, the food system has adapted. Would the same be true following any global emergency?

The food-feed system is resilient ….. but it could fail

The food system was able to recover because of particular features of this pandemic. Farming and food stocks in most parts of the world have been little affected so far. Only a few of the food supply chains have been seriously disrupted [3].  It is too soon to say whether more will be affected if lockdown and social distancing continue, but the chances are they will not be. However, other global crises could have far greater consequences.  

A diagram (Fig. 1) is used to illustrate how food and feed systems are sensitive to global events. The system is divided into four parts (Ag-economy, Ecosystem, Primary production and Food-origin) and each of these into two further parts. Of course food systems are much more complex than this: these particular sectors are shown to illustrate how vulnerable the system can be when things get out of balance.

The particular quality of this pandemic is that it has not had a severe effect on any of the parts in Fig. 1.

Fig. 1 Food production simplified for illustration into four sectors, each of two unequal parts.

The agricultural economy, shortened to Ag-economy is split into farms and related businesses that are viable in terms of making a profit and those that only exist with support, for example through subsidy, such as provided by the EU’s Common Agricultural Policy [4]. The viable fraction is smaller than the supported. (This is true for most of the UK and large parts of Europe.)

The Ecosystem provides for agriculture (nutrients, air, water, biological pest control) and needs agriculture to nurture it. Its essential parts, including soils, food webs, biodiversity, and the cycles of energy, carbon, nitrogen and water, can be described as in a state of either building or degrading. While some parts of the cropland ecosystem are at least holding steady if not building, most parts are degrading, in terms for example of declining soil quality, loss of biodiversity, soil erosion and inability to regulate water flows.

Primary production is the fixing of carbon dioxide from the air into plant matter by photosynthesis.  In Scotland, production land is divided into managed pasture for hay or grazing and another sector here named feedstocks, which refers to the dominant use of arable land to supply grain for alcohol and livestock feed, rather than staple food directly for humans [5]. The arable also produces oats, potato, fruit and vegetables, but the land area planted with these crops is small compared to the rest. Feedstock land covers less area than pasture. A large part of the products of agriculture go to export, for example as whisky and quality meat.

Food-origin is divided into that produced locally and that produced somewhere else and imported. Imports of food are essential for the UK and its constituent parts because much of farmland supports agricultural exports and livestock feed. Nourish Scotland’s Food Atlas shows around 60% of food consumed in Scotland is imported, but imports account for almost all of some types of food such as bread [6].

So there are four parts in the diagram, each given one quarter of the pie chart, and within each quarter, one of the parts is shown larger than the other. (Exactly how much larger does not matter for the illustration.) It is these imbalances make the food system vulnerable to external events.

Vulnerabilities

The tensions in and between Primary production and in Food-origin primarily determine whether a society can resist and adapt to global crises. Cereals and legumes have been the foundation of all settled societies. It is the balance between local and external sources of these, particularly the cereals, that most strongly determines vulnerability of a food system. 

In a subsistence agricultural economy, these staples are produced locally. Hunger and starvation may happen if agriculture is threatened by bad weather or an insect plague. As societies develop, they usually grow more products for export, which along with trade in mined and manufactured materials, raises wealth. That wealth allows them to import food and feed. A combination of local produce and imports then offers resilience to poor local harvests. If, however, the move to an export agriculture goes too far, then the society becomes reliant on imports for its staple food and therefore vulnerable to anything that affects imports. That is the state of the food system in Scotland and the UK as a whole.

The position is bleaker in reality because the four quarters of the diagram are connected. The international food system presently provides much of the staple diet, leaving Primary production free to concentrate on products for overseas markets. The intensity of agriculture in a competitive world is driving degradation of the Ecosystem, while an indifference of politics and society to the Ag-economy leads to low food prices and dependence on subsidy. 

Most major global cataclysms would be likely to cause serious disruption to the food supply in these circumstances. Blockade, for example: assume for whatever reason, imports stop suddenly due to the country being blockaded. Local production could not supply the needs of the people for food. The same would happen if natural phenomena damaged agriculture in those parts of the world that grow the food we rely on.

The right balance

The balance of imports and exports is crucial to food security, but lessons from the last 150 years show the complexity of it – there is no single solution.

The agricultural depression of the 1880s

The depression that began in the 1880s was a consequence of bad weather and cheap imports flooding the home market. The weather of 1879 was among the worst recorded. In Scotland livestock died on a massive scale, grain harvests were 20-40 days late in starting, wheat yields were 50-70% of the average and many cereal and tuber crops failed [7].  Shortage might have meant higher prices to keep farming solvent, but not this time. Grain produced elsewhere, was imported to fill the gap, and a downward spiral begun of poor home yields, more cheap imports and arable land converted to grass. Symon [7] compared wheat prices: 64s. 5d. a quarter in 1867, half that 20 years later, then down to 23 s. in the 1890s, the lowest for two centuries (s., shillings; d. pence).

Most parts of the UK were affected. Thirsk [8] writes: “A dramatic collapse of grain prices occurred in 1879, and continued in 1880, 1881 and 1882. Wet and cold seasons ruined one harvest after another, without bringing the usual compensation to farmers in higher prices. Instead, cheap grain flooded in from North America, and farmers were warned that if American supply fell short, then Australia could send much more.”

The main lesson of this time was that local yields were insufficient, but it was the unbridled agricultural imports drove home farming into deeper depression. A second lesson is that global events have a long reach. The areas of the main arable crops all declined from the 1880s and some kept declining until the 1930s, trends that affected the country’s ability to feed itself when imports were threatened.

Insufficiency in 1914 and again in 1939

The freedom to import food at the expense of local production continued after 1900. In 1914-1915 the government failed to appreciate the scale of the impending problem of food shortage due to restricted imports. Symon [7] writes that it was well into the war before defeat by starvation was considered possible and urgent action necessary to ensure food security. The author goes on to lament the lack of a plan, an unrealistic attitude and a ‘mood of complacency’ towards agriculture and food supply. Matters did improve, the State took control, and agricultural output increased. But self-sufficiency in food was never assured throughout this period.  Even after it, and contrary to pledges made, free trade in food returned and again drove down farming.

The response in 1939 was more immediate and effective than that 25 years earlier, but massive changes had to be made: the conversion of much grass to arable, restrictions on which crops could be given mineral fertiliser, rebalancing different types of livestock, adapting to a shortage of labour on farms and imposing food rationing [7]. The combined result of many such changes was positive in that total output and yield per unit area increased in most crops. Technology advanced also: farming became aware again of the need to apply lime to reduce acidity, to balance the main mineral fertilisers, to sow improved crop varieties and to rely less on the horse and more on tractors for cultivation. But even though writers like Symon felt the changes introduced in the early 1940s were positive for agriculture, the main technological advances in farming were yet to come.

The Agricultural Expansion programme and intensification

After the food insecurities of the 1940s, a post-war Agricultural Expansion Programme was initiated to raise production. The programme worked. It was aided by improvements in machinery, agronomy, and crop yield potential, but also a shift in areas sown to main cereals, oats being replaced by barley and wheat over much of the country [9].  Despite a rising population, the country was able in the 1960s to feed itself. Yet within a few decades, it was again dependent on food imports. Did it return to the 1880s – in one respect, yes, because the food system again took advantage of low-cost food imports, often of poor quality and nutritional value. In another respect, it was different: production was not lacking, as it was after 1878, but turned its attention away from food.

The choice

In an uncertain world, a country needs to keep its borders open for trade, both ways. But it also needs to ensure it can feed itself if it has to.

The balance needs to be redrawn: local production raised, more food than feedstocks, a shift to building rather than degrading the ecosystem and paying a fair rate for food to remove dependence on subsidy. All this is possible.

More about the topics raised here can be viewed online [10]. The Living Field web site also publishes related articles and notes [11].

Sources, references

[1] Nourish Scotland. 2020 Making the food supply chain work for everyone. By Pete Ritchie, 24 March 2020.

[2] The Food Foundation published some recent statistics on 22 May 2020: Food insecurity and debt are the new reality under lockdown https://foodfoundation.org.uk/vulnerable-groups/

[3] Seafood in Scotland is one sector that suffered severe disruption due to the pandemic. The disruption in this case was caused to a large extent by an imbalance between export and home consumption. Most of the catch (80%) was exported, so when international trade was reduced or closed, the only sectors open to it were UK catering and retail. Then the restaurants closed and major UK food retailers shut their fresh fish counters. More at Seafood Scotland on the Crisis Stricken Seafood Sector.

[4] The EU web site gives a summary of the EU Common Agricultural Policy. The James Hutton Institute produced major reports on CAP Greening measures, available for download at Land Systems Research Team. GS structured the main arguments of a Scottish Government CAP Greening Review in the form of a decision tree at Greening with decision trees.

[5] The areas of land used to grow pasture and arable or horticultural crops is detailed on the Scottish Government web site at Agricultural Statistics in Scotland. This (curvedflatlands) web site gives links to further data on food and agriculture at the Scottish Parliament Citizen’s Jury pages.

[6] Food Atlas http://www.nourishscotland.org/resources/food-atlas/

[7] Symon J A. 1959. Scottish Farming – past and present. Oliver & Boyd, Edinburgh and London, UK.

[8] Thirsk J. 1997. Alternative agriculture – a history from the Black Death to the present day. Oxford University Press, Oxford, UK.

[9] A brief history of changing areas and yields of oats, barley and wheat over the past 150 years on this web site at Three grain resilience.

[10] To find out more about local food systems, try these organisations: Scottish Food Coalition and their Campaign for a Good Food Nation; the Food Foundation https://foodfoundation.org.uk/ and Scotland the Bread.

[11] Living Field articles: City University’s food systems diagram: Five spheres around the food chain, and a look at the 10 crops from across the world that go into a simple meal of Beans on Toast revisited.

Author/contact: geoff.squire@outlook.com